
The Week in Review: 03/25/2024
"In prosperity, our friends know us; in adversity, we know our friends." – John Churton Collins
Good Morning ,
Last week was another fine week, sending three indices to new record highs.
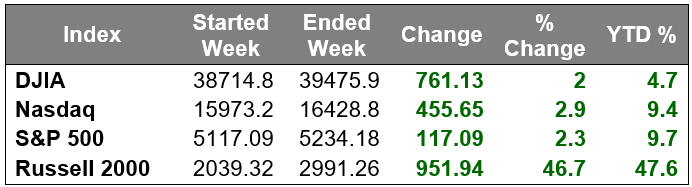
The S&P 500 for its part closed above 5,200 for the first time with a 2.3% gain last week. The Nasdaq Composite jumped 2.9% and the Dow Jones Industrial Average gained 2.0%.
The gains were largely in response to the FOMC policy announcement. The committee voted unanimously to leave the target range for the fed funds rate unchanged at 5.25-5.50%. This was expected but was not the reason for increased buying activity.
Buying increased due to the closely watched dot plot, which is included in the updated Summary of Economic Projections (SEP), showing that the Fed still anticipates three rate cuts this year despite recent inflation readings coming in hotter than expected.
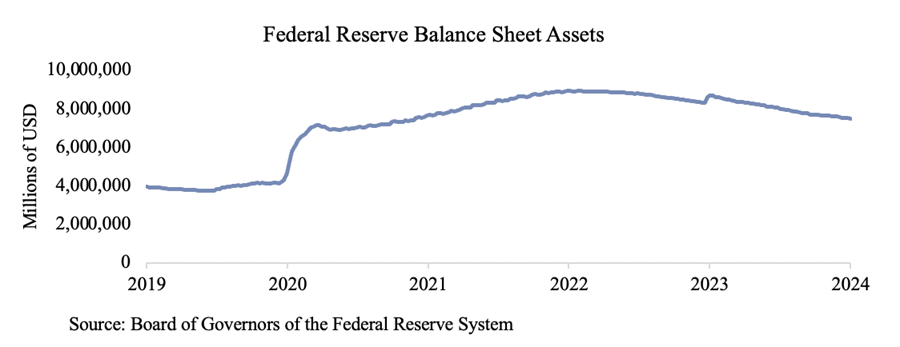
Fed Chair Powell's press conference following the FOMC policy announcement didn't deter the influx of buying. He largely reiterated prior comments, indicating that the Fed needs more evidence that inflation is moving toward the 2% target before cutting rates. Mr. Powell also said that it will be appropriate to slow the pace of asset runoff fairly soon.
Rate cut expectations moved up last week, contributing to the positive bias in the stock market. The implied likelihood of a June cut rose to 75.4% from 58.8% last week, according to the CME FedWatch Tool.
The price action in Treasuries also contributed to the positive bias in the stock market. The 2-yr note yield declined 12 basis point to 4.60% and the 10-yr note yield fell eight basis points to 4.22%.
Mega cap stocks had an outsized impact on index gains.
Only one of the S&P 500 sectors logged a decline -- real estate (-0.4%) -- while the communication services (+4.8%), industrials (+2.9%), information technology (+2.9%), and consumer discretionary (+2.8%) sectors saw the largest gains.
Market Snapshot…
- Oil Prices – Oil prices slipped on Friday and were flat on the week as the possibility of a ceasefire in Gaza weakened crude benchmarks. West Texas Intermediate crude futures (WTI) settled at $80.63 a barrel, falling 44 cents. Brent crude futures settled at $85.43, losing 35 cents. Both benchmarks logged less a than 1% change on the week.
- Gold– Gold dipped on Friday as the dollar strengthened but was on track for a weekly gain after rallying to a record high in the previous session. Spot Gold was down 0.7% at $2,166.57 per ounce. U.S. gold futures settled 1.1% lower at $2,160. Silver finished the week at $24.843.
- S. Dollar– The dollar cinched a second week of gains on Friday. The dollar index, a measure of U.S. currency against six major trading partners, rose 1%, while the dollar weakened 0.15% at 151.38. Euro/US$ exchange rate is now 1.084.
- S. Treasury Rates– U.S. Treasury yields fell on Friday. The yield on the 10-Year Treasury was down by more than 6 basis points to 4.206%.
- Asian shares mixed in overnight trading.
- European markets are trading lower.
- Domestic markets are indicated to open mostly in the red this morning.
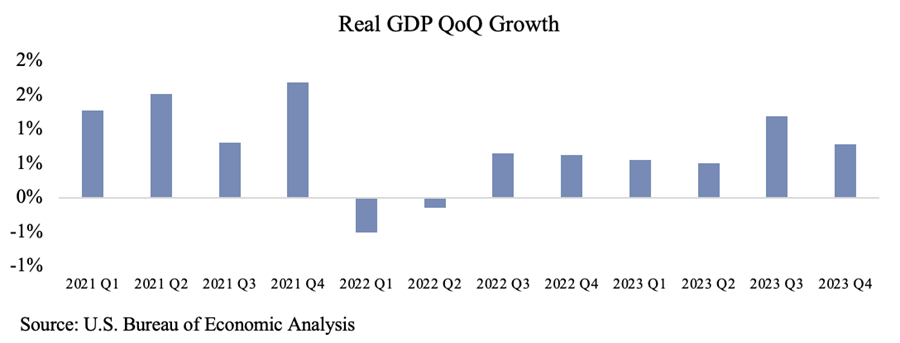
Economic growth (real GDP) was projected significantly higher for 2024, at 2.1%, compared to the 1.4% projection in December. Real GDP came in higher than expected in Q4 at 3.2%, and the Atlanta Fed’s latest estimate for the first quarter is 2.1%. The overall economy has performed better than expected given the inflationary environment and the Fed’s aggressive monetary policy shifts. The updated projections enforce the belief that this trend should continue.
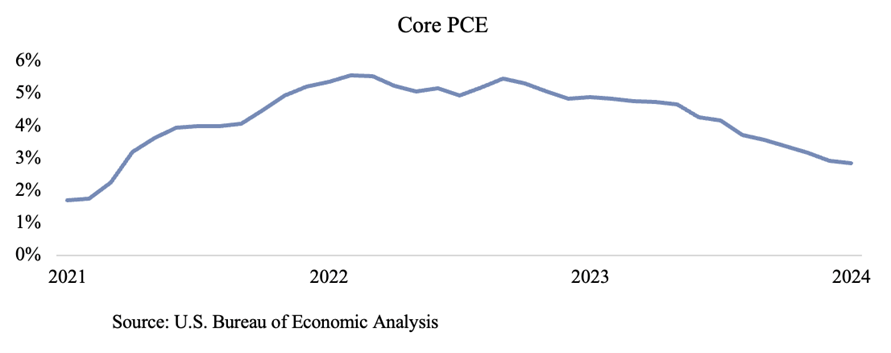
Inflation projections were also higher than in December with core PCE inflation projected to settle at 2.6% at year-end. Inflation has come down significantly from its peak but has proven itself to be sticky.
This holiday-shortened week will feature a third look at fourth quarter GDP and February’s PCE report.
We will also hear from additional Fed speakers regarding their individual outlooks on monetary policy.
Have a wonderful week!
The opinions expressed herein are those of Michael Hilger and not necessarily those of Raymond James & Associates, Inc., and are subject to change without notice. The information contained in this report does not purport to be a complete description of the securities, markets, or developments referred to in this material. There is no assurance any of the trends mentioned will continue or forecasts will occur. The information has been obtained from sources considered to be reliable, but Raymond James does not guarantee that the foregoing material is accurate or complete. Investing involves risk and you may incur a profit or loss regardless of strategy selected.
The information contained herein is general in nature and does not constitute legal or tax advice. Inclusion of these indexes is for illustrative purposes only. Keep in mind that individuals cannot invest directly in any index, and index performance does not include transaction costs or other fees, which will affect actual investment performance. Individual investor's results will vary. Past performance does not guarantee future results. The Dow Jones Industrial Average (INDU) is the most widely used indicator of the overall condition of the stock market, a price-weighted average of 30 actively traded blue chip stocks, primarily industrials. The Dow Jones Transportation Average (DJTA, also called the "Dow Jones Transports") is a U.S. stock market index from the Dow Jones Indices of the transportation sector, and is the most widely recognized gauge of the American transportation sector. Standard & Poor's 500 (SPX) is a basket of 500 stocks that are considered to be widely held. The S&P 500 index is weighted by market value, and its performance is thought to be representative of the stock market as a whole. The S&P 500 is an unmanaged index of widely held stocks that is generally representative of the U.S. stock market. Keep in mind that individuals cannot invest directly in any index, and index performance does not include transaction costs and other fees, which will affect investment performance. Individual investor’s results will vary. The NASDAQ Composite Index (COMP.Q) is an index that indicates price movements of securities in the over-the-counter market. It includes all domestic common stocks in the NASDAQ System (approximately 5,000 stocks) and is weighted according to the market value of each listed issue. The NASDAQ-100 (^NDX) is a modified capitalization-weighted index. It is based on exchange, and it is not an index of U.S.-based companies. The Russell 2000 index is an unmanaged index of small cap securities which generally involve greater risks.
U.S. government bonds and Treasury notes are guaranteed by the U.S. government and, if held to maturity, offer a fixed rate of return, and guaranteed principal value. U.S. government bonds are issued and guaranteed as to the timely payment of principal and interest by the federal government. Treasury notes are certificates reflecting intermediate-term (2 - 10 years) obligations of the U.S. government.
The companies engaged in business related to a specific sector are subject to fierce competition and their products and services may be subject to rapit obsolescence. There are additional risks associated with investing in an individual sector, including limited diversification.
Dividends are not guaranteed and must be authorized by the company's board of directors.
Diversification does not ensure a profit or guarantee against a loss.
Investing in oil involves special risks, including the potential adverse effects of state and federal regulation and may not be suitable for all investors.
International investing involves special risks, including currency fluctuations, differing financial accounting standards, and possible political and economic volatility.
The companies engaged in the communications and technology industries are subject to fierce competition and their products and services may be subject to rapid obsolescence.
Gold is subject to the special risks associated with investing in precious metals, including but not limited to: price may be subject to wide fluctuation; the market is relatively limited; the sources are concentrated in countries that have the potential for instability; and the market is unregulated.
The information contained within this commercial email has been obtained from sources considered reliable, but we do not guarantee the foregoing material is accurate or complete.
Any information is not a complete summary or statement of all available data necessary for making an investment decision and does not constitute a recommendation. Prior to making an investment decision, please consult with your financial advisor about your individual situation.
Charts are reprinted with permission, further reproduction is strictly prohibited.
If you would like to be removed from this e-Mail Alert Notification, PLEASE click the Reply button, type "remove" or "unsubscribe" in the subject line and include your name in the message, then click Send.
