
The Week in Review: 03/18/2024
“Observation is a dying art.” – Stanley Kubrick
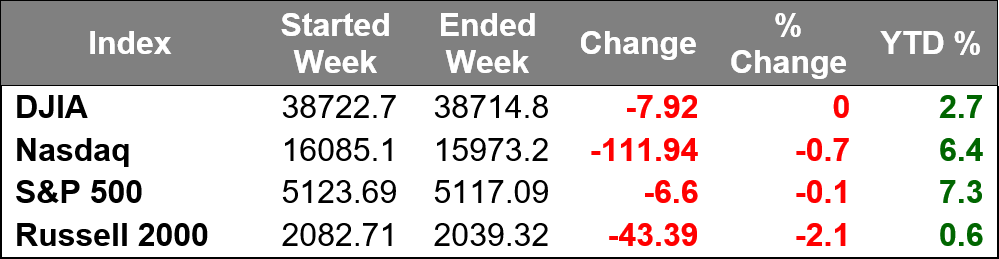
Our major indices settled with relatively modest declines last week… as our markets took a much-needed pause, after a very strong start to 2024.
The Dow Jones Industrial Average was unchanged from the prior week… the S&P 500 declined just 0.1%, and the Nasdaq Composite logged a 0.7% loss. Meanwhile, the Russell 2000 underperformed, dropping 2.1%.
Market participants received two inflation readings suggesting price pressures remain stubborn… both the Consumer Price Index (CPI) and Producer Price Index (PPI) for February came in hotter than expected, but stocks seemed to take this in stride.
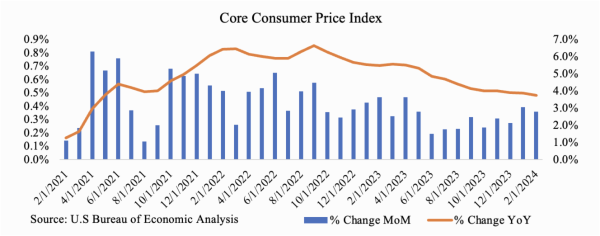
February’s CPI and PPI reports show that, once again, disinflation does not move in a straight line. The overall trend has not changed its direction, but the path back to the Fed’s 2% target will take longer than many of us would like.
The S&P 500 even reached a new record high on Tuesday following the hot CPI reading. This report didn't spook the markets due to the notion that the largest factor in the increase -- the index for shelter -- will lessen in coming months.
The relatively muted response in the stock market was due also to the notion that the Fed's policy decision on Wednesday may provide more clarity on how these reports factor into the Fed's thinking.
The Treasury market had a more pronounced response to the data. The 10-yr note yield jumped 21 basis points this week to 4.30% and the 2-yr note yield settled 23 basis points higher at 4.72%.
Other data last week included a February retail sales report that was a bit weaker than expected but still up nicely versus the prior month, and some initial and continuing jobless claims data that reflected ongoing strength in the labor market.
The modestly negative bias in the stock market was also related to a growing sense among some participants that stocks are due for a pullback.
Six of the 11 S&P 500 sectors logged declines.
The rate-sensitive real estate sector was the worst performer by a decent margin, dropping 3.1%. The consumer discretionary sector was the next worst performer, declining 1.2%.
Meanwhile, the energy sector saw the largest gain, jumping 3.7% with the materials sector registering a 1.5% gain.
Market Snapshot…
- Oil Prices – Tight crude market expectations forced oil futures into a weekly gain as forecasters predicted a supply deficit rather than a surplus. West Texas Intermediate crude futures (WTI) fell 22 cents, or 0.27%, to settle at $81.04 a barrel. Brent crude futures dropped 8 cents, or 1.09% to close at $85.34 a barrel.
- Gold– Gold prices logged their first weekly drop in four as expectations for an interest rate cut were lower. Spot Gold was little changed at $2,159.99 per ounce. U.S. gold futures settled 0.3% lower to $2,161.5. Silver closed out the week at $25.381.
- S. Dollar– The dollar was on pace to mark its biggest weekly gain since mid-January after data showed the economy remained stable. The dollar posed a weekly gain of 0.7%, but the dollar index was flat at 103.43. Euro/US$ exchange rate is now 1.09.
- S. Treasury Rates– The yield on the 10-year Treasury was little changed as investors considered the outlook for interest rates after inflation data was released. The yield on the 10-year Treasury note was down by less than one basis point at 4.3%.
- Asian shares were up in overnight trading.
- European markets are trading higher.
- Domestic markets are trading in the green this morning.
This week’s main event will be the Fed’s meeting and interest rate decision on Wednesday. We believe that the federal funds rate will hold steady at its current rate of 5.25-5.50%. On top of its interest rate decision, the Fed will also release its updated Summary of Economic Projections, which outlines the Fed’s expectations on the paths of inflation, unemployment, interest rates, and other economic factors in the short- and long-term.
Have a fantastic week!
The opinions expressed herein are those of Michael Hilger and not necessarily those of Raymond James & Associates, Inc., and are subject to change without notice. The information contained in this report does not purport to be a complete description of the securities, markets, or developments referred to in this material. There is no assurance any of the trends mentioned will continue or forecasts will occur. The information has been obtained from sources considered to be reliable, but Raymond James does not guarantee that the foregoing material is accurate or complete. Investing involves risk and you may incur a profit or loss regardless of strategy selected.
The information contained herein is general in nature and does not constitute legal or tax advice. Inclusion of these indexes is for illustrative purposes only. Keep in mind that individuals cannot invest directly in any index, and index performance does not include transaction costs or other fees, which will affect actual investment performance. Individual investor's results will vary. Past performance does not guarantee future results. The Dow Jones Industrial Average (INDU) is the most widely used indicator of the overall condition of the stock market, a price-weighted average of 30 actively traded blue chip stocks, primarily industrials. The Dow Jones Transportation Average (DJTA, also called the "Dow Jones Transports") is a U.S. stock market index from the Dow Jones Indices of the transportation sector, and is the most widely recognized gauge of the American transportation sector. Standard & Poor's 500 (SPX) is a basket of 500 stocks that are considered to be widely held. The S&P 500 index is weighted by market value, and its performance is thought to be representative of the stock market as a whole. The S&P 500 is an unmanaged index of widely held stocks that is generally representative of the U.S. stock market. Keep in mind that individuals cannot invest directly in any index, and index performance does not include transaction costs and other fees, which will affect investment performance. Individual investor’s results will vary. The NASDAQ Composite Index (COMP.Q) is an index that indicates price movements of securities in the over-the-counter market. It includes all domestic common stocks in the NASDAQ System (approximately 5,000 stocks) and is weighted according to the market value of each listed issue. The NASDAQ-100 (^NDX) is a modified capitalization-weighted index. It is based on exchange, and it is not an index of U.S.-based companies. The Russell 2000 index is an unmanaged index of small cap securities which generally involve greater risks.
U.S. government bonds and Treasury notes are guaranteed by the U.S. government and, if held to maturity, offer a fixed rate of return, and guaranteed principal value. U.S. government bonds are issued and guaranteed as to the timely payment of principal and interest by the federal government. Treasury notes are certificates reflecting intermediate-term (2 - 10 years) obligations of the U.S. government.
The companies engaged in business related to a specific sector are subject to fierce competition and their products and services may be subject to rapit obsolescence. There are additional risks associated with investing in an individual sector, including limited diversification.
Diversification does not ensure a profit or guarantee against a loss.
Investing in oil involves special risks, including the potential adverse effects of state and federal regulation and may not be suitable for all investors.
International investing involves special risks, including currency fluctuations, differing financial accounting standards, and possible political and economic volatility.
The companies engaged in the communications and technology industries are subject to fierce competition and their products and services may be subject to rapid obsolescence.
Gold is subject to the special risks associated with investing in precious metals, including but not limited to: price may be subject to wide fluctuation; the market is relatively limited; the sources are concentrated in countries that have the potential for instability; and the market is unregulated.
The information contained within this commercial email has been obtained from sources considered reliable, but we do not guarantee the foregoing material is accurate or complete.
Any information is not a complete summary or statement of all available data necessary for making an investment decision and does not constitute a recommendation. Prior to making an investment decision, please consult with your financial advisor about your individual situation.
Charts are reprinted with permission, further reproduction is strictly prohibited.
