
The Week in Review 10/30/2023
“You hit home runs not by chance but by preparation.” ~Roger Maris
Good Morning,
We struggled yet again in the markets last week.
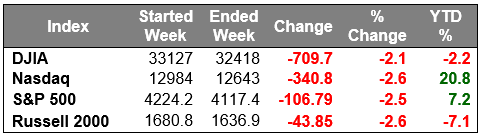
We began with the S&P 500 slipping below its 200-day moving average, again… by the end of the week, the S&P 500 settled 10.3% lower than the July 31 closing high (a technical correction) and tested support near the 4,100 level. Only one of the 11 S&P 500 sectors logged a gain -- utilities (+1.2%) -- while the communication services (-6.3%) and energy (-6.2%) sectors saw the largest declines.
Weakness in the communication services sector was driven by Alphabet, which suffered a 9.8% decline on the week after an earnings report that contained some relatively disappointing growth for its cloud business, and Meta Platforms, which fell 3.9% following its earnings report. Microsoft and Amazon.com were met with positive reactions after reporting quarterly results.
Participants were also digesting a slate of mostly better-than-expected earnings results from blue chip names. Verizon, Coca-Cola, Dow, RTX, General Electric, and 3M were among the standouts in that respect.
Earnings across the board, are hanging in…
Geopolitical angst contributed to the overall anxiety throughout the week, but tensions peaked on Friday following reports that the US carried out airstrikes against Iranian backed targets in Syria. Separate reports indicated that Israel is expanding ground operations in Gaza. Investors learned about those developments right before the weekend when markets are closed for trading and traders can't react in real-time.
There was a heavy news flow last week in addition to the headlines and earnings news. The headlines included Ford and the UAW reaching a tentative agreement, the ECB leaving its corridor of key interest rates unchanged following ten consecutive rate increases, and a batch of economic data.
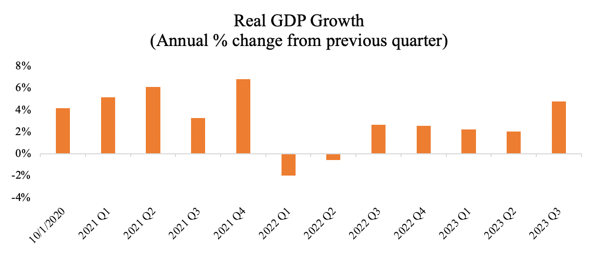
Last week’s preliminary GDP report came in at an annualized rate of 4.9%, by and large above estimates of 4.5% and the largest gain in nearly two years.
Consumer spending was the biggest contributor to the economic growth during the quarter, increasing 4% over the previous quarter. Consumer savings however, took a step back. Personal savings were only 3.8% of disposable income during the quarter, compared to 5.2% in the second quarter. Total savings also declined by $263 billion. While consumer spending is increasing, individuals and families are saving less and even dipping into those savings to support their spending.
Spending drove the economy to a robust 4.9% annual growth rate in the July-September quarter, the best showing in nearly two years. We'll have to see whether that is sustainable in the fourth quarter and holiday season.
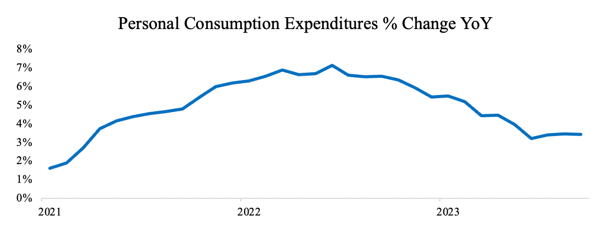
Underlying inflation increased with consumer spending. The Personal Consumption Expenditures (PCE) Index increased 0.3% for the month of September and 3.4% over the past year. Core PCE, which excludes food and energy, increased 0.4% for the month of September and 3.7% year-over-year.
The economic calendar was highlighted by a whopping 4.9% real GDP growth in the third quarter and a September Personal Income and Spending report that failed to show a strong trend of disinflation. Those reports reflect ongoing strength in the economy and inflation that looks somewhat sticky, which is not likely to persuade the Fed to cut rates anytime soon.
Treasuries were better behaved last week, but that did not help stocks. The 2-yr note yield declined six basis points to 5.03% and the 10-yr note yield fell seven basis points to 4.85%.
In other news, Rep. Mike Johnson (R-LA) was elected Speaker of the House after receiving unanimous Republican support.
Market Snapshot…
- Oil Prices – Oil prices were up 3% on concerns about Middle East supplies. West Texas Intermediate crude futures (WTI) rose $2.14, or 2.6% to close at $85.35 a barrel. Brent crude rose $2.25, or 2.6%, to close at $90.18 a barrel.
- Gold– Gold prices edged higher and headed for a third consecutive weekly gain. Spot Gold was up nearly 0.5% at $1,933.69 per ounce, while U.S. gold futures added 0.1% to $1,998.50. Silver finished the week at $22.887.
- S. Dollar– The dollar index was 0.1% lower at 106.47 with some of the weakness attributed to month-end flows where investors buy and sell currencies to rebalance their portfolios. Euro/US$ exchange rate is now 1.063.
- S. Treasury Rates– Treasury yields dipped lower Friday as investors weighed economic data that could affect the Fed’s monetary policy. The yield on the 10-year Treasury note was down 1 basis point at 4.83%.
- Asian shares were mixed in overnight trading.
- European Markets are trading higher.
- Domestic markets are indicated to open in the green this morning.
We are at the halfway point of earnings season with 49% of S&P 500 companies reporting. Of those companies, combined earnings have grown 2.7% year-over-year. If the pace continues, this would be the first year-over-year growth since Q3 2022.
This week will feature the Fed’s FOMC meeting on Tuesday and Wednesday, where it will make another interest rate decision. Despite the strong economic data and pick up in inflation, the rise in long-term rates will likely persuade the Fed to hold rates steady for a second consecutive meeting. We will also receive both Manufacturing and Non-Manufacturing PMI data, as well as the highly watched jobs report this week.
Have a wonderful week, Go Rangers!!
The opinions expressed herein are those of Michael Hilger and not necessarily those of Raymond James & Associates, Inc., and are subject to change without notice. The information contained in this report does not purport to be a complete description of the securities, markets, or developments referred to in this material. There is no assurance any of the trends mentioned will continue or forecasts will occur. The information has been obtained from sources considered to be reliable, but Raymond James does not guarantee that the foregoing material is accurate or complete. Investing involves risk and you may incur a profit or loss regardless of strategy selected.
The information contained herein is general in nature and does not constitute legal or tax advice. Inclusion of these indexes is for illustrative purposes only. Keep in mind that individuals cannot invest directly in any index, and index performance does not include transaction costs or other fees, which will affect actual investment performance. Individual investor's results will vary. Past performance does not guarantee future results. The Dow Jones Industrial Average (INDU) is the most widely used indicator of the overall condition of the stock market, a price-weighted average of 30 actively traded blue chip stocks, primarily industrials. The Dow Jones Transportation Average (DJTA, also called the "Dow Jones Transports") is a U.S. stock market index from the Dow Jones Indices of the transportation sector, and is the most widely recognized gauge of the American transportation sector. Standard & Poor's 500 (SPX) is a basket of 500 stocks that are considered to be widely held. The S&P 500 index is weighted by market value, and its performance is thought to be representative of the stock market as a whole. The NASDAQ Composite Index (COMP.Q) is an index that indicates price movements of securities in the over-the-counter market. It includes all domestic common stocks in the NASDAQ System (approximately 5,000 stocks) and is weighted according to the market value of each listed issue. The Russell 2000 index is an unmanaged index of small cap securities which generally involve greater risks
Dividends are not guaranteed and must be authorized by the company's board of directors.
Diversification does not ensure a profit or guarantee against a loss.
Investing in oil involves special risks, including the potential adverse effects of state and federal regulation and may not be suitable for all investors.
International investing involves special risks, including currency fluctuations, differing financial accounting standards, and possible political and economic volatility.
The companies engaged in the communications and technology industries are subject to fierce competition and their products and services may be subject to rapid obsolescence.
Gold is subject to the special risks associated with investing in precious metals, including but not limited to: price may be subject to wide fluctuation; the market is relatively limited; the sources are concentrated in countries that have the potential for instability; and the market is unregulated.
The information contained within this commercial email has been obtained from sources considered reliable, but we do not guarantee the foregoing material is accurate or complete.
Any information is not a complete summary or statement of all available data necessary for making an investment decision and does not constitute a recommendation. Prior to making an investment decision, please consult with your financial advisor about your individual situation.
Charts are reprinted with permission, further reproduction is strictly prohibited.
