Deja Vu All Over Again
“2000 party over oops out of time, so tonight I am going to party like it’s 1999”
-Prince
With respect to the economy, markets, geo-politics and myriad other things, each period has unique differences. Nevertheless, today’s market environment has significant similarities to the late 1990s (and large differences compared to 15 years ago). In the late ‘90s and throughout most of the past year, market returns have been strong as are current readings of investor confidence.i Then and now, large cap-growth returns have handily outpaced those of large cap ‘value,’ U.S. mid and small caps and international equity segments. Furthermore, net investment flows into equities are very strong, but like the late 1990s and Q1 of 2000, concentrated in large cap stocks, particularly in the tech and other growth segments. After a good year in 2022, flows into traditional ‘value’ and dividend segments have been anemic. Seeing ‘where the returns are,’ investors deem it prudent to add aggressively into the ‘Magnificent 7’ and other large cap growth stocks which have increased not only their price gains, but their underlying valuation metrics.ii This narrow leadership has no doubt caused most active managers to underperform the S&P 500 and NASDAQ indexes.iii There is no doubt that long-term investors in large cap growth stocks have earned well above average returns last year. However, for those who only developed conviction (and invested accordingly) recently, it remains to be seen if these lopsided allocations will yield significant long-term benefit. By arriving relatively late into the leaders, many investors have only captured a relatively modest share of this past year’s well-above average gains. Much like raucous New Year’s Eve parties, arriving late and staying too long can be a mistake. All of this leaves me with a strong sense of déjà vu.
As you know, we don’t profess to know what the near term holds – Wall Street serves up surprises regularly and often and its entirely possible large cap growth will continue to lead other segments by a substantial margin. Strong and lopsided flows could easily continue to fuel this current streak. Nevertheless, we have deep conviction that broad diversification and adoption of a long-term commitment helps foster favorable outcomes with decidedly less of a rollercoaster feel that often accompanies concentrated investment portfolios and attempts to time one’s purchases and sales. Please click on the link below. It is an interesting infographic from Vanguard that shows rolling 1, 3, 5, 7 and 10-year returns for major U.S. and international stock and bond indices from 1990 through early 2023.
https://vanguard.vo.llnwd.net/o1/EXT/FAS/Diversification_IARC_Video2-4-27-2023.mp4
As this short video shows, returns for each underlying index are quite volatile in 1-year periods and much more stable over longer intervals. Also, the underlying segments – especially those for the equity market are prone to being significant detractors in some periods and significant contributors in others. In addition, no segment performs relatively well or poorly compared to the others along the way. Sometimes U.S. equity returns are superior and at others, international segments lead performance. By owning all of them, investors can reduce volatility compared to owning any single segment. Doing so, helps ensure investors reduce the risks associated with being concentrated in the wrong place at the wrong time.
There can be little doubt that some of today’s mega cap darlings are well run, highly profitable businesses. They may well continue to generate favorable growth in sales, earnings and cashflow for many years to come. That said, we believe one of the reasons why they performed exceptionally well in 2023 is due to the fact that most lost significant value in 2022.iv
This past year’s strong gains have captured investors’ attention and interest, but in doing so, future gains may be relatively modest. Conversely, we continue to believe that future return expectations for segments like U.S. ‘value’ and international markets including the emerging markets may be quite favorable. These segments have been relatively unrewarding to own, not only this past year but for a much longer period. In our judgment investor expectations are low and this is reflected in valuation metrics that make them quite attractive over a multi-year time period of 3, 5, 10 or more years. Cycles in the stock and bond markets are highly likely in the future as they have been throughout history. We believe investors are well served to avoid the temptation to follow headlines and recent market trends in favor of adopting sensible allocations that tend to reduce volatility of returns.
In sum, we wish we knew where the best return opportunities are in the near term. If we did, we would allocate accordingly. Because we do not, we believe investors are well served by adopting and adhering to a sensible allocation strategy through thick and thin market environments. In our experience, investors who do adopt a long-term strategic allocation tend to avoid the often-costly mistakes that investors collectively are prone to make. Markets are known to have extended periods where some segments perform appreciably better than others and FOMO (fear of missing out) can cause many to invest aggressively at what prove to be far closer to market tops than many - including pundits on T.V. imagine. We believe investors who resist the temptation to make large and significant changes in their portfolio allocations have much higher likelihood of achieving their short, intermediate and long-term goals. Our disciplined investment approach is based upon these time-tested principles, and we remain dedicated to your financial well-being.
Warmest regards at the start of this New Year!
W. Richard Jones, CFA
Partner, Harmony Wealth Partners
i The readings from the AAII (American Association of Individual Investors) at or near year-end these past 3 years -
| Bullish | Neutral | Bearish | |
| 12/20/23 | 52.9% | 26.2% | 20.9% |
| 12/22/22 | 20.3% | 27.3% | 52.3% |
| 12/30/21 | 37.8% | 31.8% | 30.5% |
Source AAII.com
Observation: Investors tend to be bullish or bearish based upon recent trends. They are often caught off-sides. At or peak levels of bullishness, returns over the ensuing 12 months tend to be poor. At or near extreme readings in bearishness, returns tend to be rather good over the next 12 months. In 1986, Warren Buffett’s said, “We simply attempt to be fearful when others are greedy and to be greedy when others are fearful.”
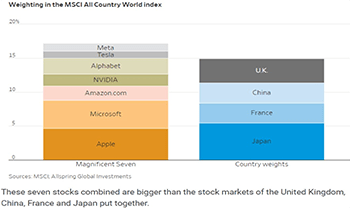
Comment: As you can see the market value of the Magnificent 7 stocks exceeds the aggregate value of the equity markets in Japan, France, China and the U.K. combined. It begs the question, ‘Which of these securities/markets offers the highest prospective returns?’
iiiI fully expect to share the results for the 2023 SPIVA (e.g. S&P index versus active) results when they become available in a few months’ time.
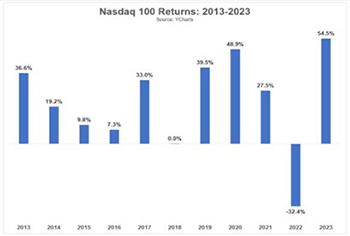
Source: YCharts Comment: The NASDAQ’s gains are noteworthy, but we may well see significantly lower gains in the future.
Any opinions are those of W. Richard Jones and not necessarily those of Raymond James. This material is being provided for information purposes only and is not a complete description, nor is it a recommendation. The information has been obtained from sources considered to be reliable, but we do not guarantee that the foregoing material is accurate or complete. Any information is not a complete summary or statement of all available data necessary for making an investment decision and does not constitute a recommendation. Expressions of opinion are as of this date and are subject to change without notice. This information is not intended as a solicitation or an offer to buy or sell any security referred to herein. Investments mentioned may not be suitable for all investors. There is no guarantee that these statements, opinions or forecasts provided herein will prove to be correct. Past performance may not be indicative of future results. Investing involves risk and you may incur a profit or loss regardless of strategy selected, including diversification and asset allocation. Every investor's situation is unique and you should consider your investment goals, risk tolerance and time horizon before making any investment. Prior to making an investment decision, please consult with your financial advisor about your individual situation. The S&P 500 is an unmanaged index of 500 widely held stocks that is generally considered representative of the U.S. stock market. The NASDAQ composite is an unmanaged index of securities traded on the NASDAQ system. International investing involves special risks, including currency fluctuations, differing financial accounting standards, and possible political and economic volatility. Links are being provided for information purposes only. Raymond James is not affiliated with and does not endorse, authorize or sponsor any of the listed websites or their respective sponsors. Raymond James is not responsible for the content of any website or the collection or use of information regarding any website's users and/or members.


