
September 2023
It’s Hard to predict the future
In July, my wife and I welcomed a baby boy into our family. Around mid-June, we started anticipating his arrival – we were so confident he was going to come early. He didn’t. His due date came and passed, and we even heard from doctors that my wife would likely have to be induced as she likely wouldn’t go into labor on her own. Well, she did go into labor on her own. My point? Predicting the future is hard.
One of the most frequent questions I get asked is “What do you think the market is going to do?” People are enamored with trying to predict the future. The problem? It rarely works. A study by Factset on the years of 2002 – 2021 revealed the following:
- 3% is the average difference between analysts estimate of the final price of the index and the actual closing price at the end of the year
- Much of this difference came when there has been market declines:
- 2002 – analysts overestimated the closing price for the year by 59%.
- 2008 - analysts overestimated the closing price for the year by 92%.
- 2022 – analysts overestimated the closing price for the year by 20%
- If you excluded these years (2002 and 2008), the difference in the remaining 18 years is only .8%!
What’s this mean for you?
It’s pointless to try and predict the future of financial markets over a short time frame such as a year. When things in the economy and markets go smoothly, analysts tend to be able to get fairly close. The problem? Things don’t always go as planned.
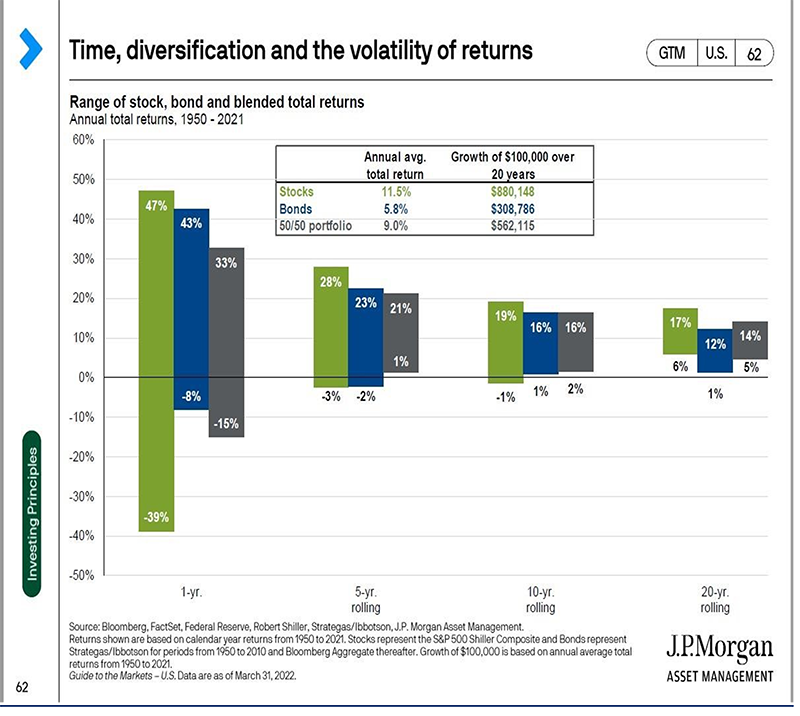
We all know the historical performance of an investment is not a guarantee of the future performance of that investment. That being said, looking at historical return averages of investments are helpful for framing perspective. The picture below shows data provided by JP Morgan from 1950 – 2021. The green bars represent stocks (S&P 500), the blue bars represent bonds, and the gray bar is a 50/50 mix. The top numbers and the bottom numbers are the ranges of returns that have been seen over that time period throughout history. So, for any 5 year rolling time frame, stocks have had a range of returns from 28% to -3%. The box above the graph gives the annual average total return for the three comparisons.
So, instead of trying to worry about what the future holds or what the talking heads on TV claim the future holds, an alternative would be to use historical averages such as this – especially over long time horizons – to help frame your perspectives around return.
Sign up for a 15 Minute Ask anything Session:
https://calendly.com/greg-reabold/15-minute-ask-anything-session
The foregoing information has been obtained from sources considered to be reliable, but we do not guarantee that it is accurate or complete, it is not a statement of all available data necessary for making an investment decision, and it does not constitute a recommendation. Any opinions are those of Greg Reabold and not necessarily those of Raymond James. Investing involves risk and you may incur a profit or loss regardless of strategy selected.
*Source: https://insight.factset.com/industry-analysts-predict-a-13-price-increase-for-sp-500-in-2023
Investing involves risk and you may incur a profit or loss regardless of strategy selected, including diversification and asset allocation.
Past performance may not be indicative of future results. The S&P 500 is an unmanaged index of 500 widely held stocks that is generally considered representative of the U.S. stock market.
