What's Behind the Curtain? A Look Beyond the S&P 500's Top Ten
“Pay no attention to what’s behind the curtain” -- The Wizard of Oz. Once exposed, the Great & Powerful Oz wasn’t at all what Dorothy expected. Neither are the current S&P returns.
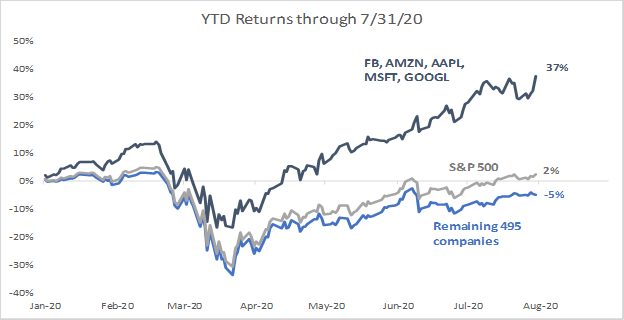
We’re pulling back the curtain to reveal the handful of stocks driving YTD returns in the S&P 500 index. The top 10 performers have contributed heavily to the index return while the other 490 stocks have detracted from it.
Using common broad market indexes (ie. S&P 500 Index) as a gauge of overall market performance is becoming increasingly misleading. As of 7/31/2020, the S&P 500 had a year to date return of + 2.38%. What is more interesting, detailed in the chart below, is the return variance in the 5 largest stocks (Facebook, Amazon, Apple, Google, Microsoft). Those stocks have a YTD return of +37% and the remaining 495 companies YTD return is -5%.
|
|
|
S&P 500 Weight (%) |
YTD return |
Cont to SP500 return |
|
Ticker |
Company |
bps |
||
|
AMZN |
AMAZON COM INC |
4 |
71 |
229 |
|
AAPL |
APPLE INC |
5 |
45 |
213 |
|
MSFT |
MICROSOFT CORP |
5 |
31 |
155 |
|
FB |
FACEBOOK INC |
2 |
24 |
49 |
|
NVDA |
NVIDIA CORPORATION |
1 |
81 |
48 |
|
PYPL |
PAYPAL HLDGS INC |
1 |
81 |
42 |
|
GOOGL |
ALPHABET INC |
3 |
11 |
35 |
|
NFLX |
NETFLIX INC |
1 |
51 |
31 |
|
ADBE |
ADOBE INC |
1 |
35 |
22 |
|
HD |
HOME DEPOT INC |
1 |
23 |
21 |
|
S&P 500 |
|
100% |
2% |
238 |
|
Top 10 contributors |
23 |
41 |
846 |
|
|
S&P 500 ex-top 10 |
77 |
-4 |
-608 |
|
Source: Putnam Investments Quantitative Equity Group

Source: Putnam Investments Quantitative Equity Group
Easily misunderstood index calculation methodology is responsible for the current situation. The S&P 500 Index is a market capitalization weighted index. You might think that the 500 stocks in the S&P 500 index that each stock would account for .20% of the overall total. Not so. Actually, the 10 largest stocks now make up 23% of the index weight and those 10 stocks are up 41% YTD. Bigger companies have a bigger weighting in the index. As a comparison, the S&P 500 Equal Weight Index has a YTD -6.45%.
Assessing and managing risk is more challenging than ever. If you invest in the stock market, it is important to take a close look behind the curtain and understand how risks are changing and in some cases compounding as a handful of stocks are doing the heavy lifting for S&P 500 returns.
If any of this has you asking questions or needing clarification, connect with us. Our deep bench of thought leaders and resources are here to help.
The S&P 500 is unmanaged and cannot be invested into directly. Past performance is no guarantee of future results. This material is for informational purposes only. Any information is not a complete summary or statement of all available data necessary for making an investment decision and does not constitute a recommendation.

