Lifeboat Drills
When a ship is on calm seas, the captain orders lifeboat drills. Get the crew on the stopwatch, and stress test them for when the inevitable rough seas come.
It’s always a good time for some stock market lifeboat drills.
Historically, stocks have generated extraordinary returns over time. This is why so many investors allocate a portion of their $ to stocks. They know that historically it has been one of the only methods for keeping ahead of the always advancing and erosive rising cost of living.
Returns, Jan 1990 – Nov 2024
| US Stocks | +3,120% |
| US Bonds | +270% |
| US Real Estate | +261% |
| US Cash | +50% |
And that +3,120% return was through some brutal times:
- 1990-1991 Recession
- Invasion of Kuwait
- Tech Bubble
- 9/11
- Iraq War
- 2008 Great Financial Crisis
- Debt Ceiling
- Multiple Elections
- Covid
- Etc
But we all know stocks don’t make it easy. They make you work for those returns.
The lifeboat drill is this:
- Odds are high that stocks will experience a pullback of 10% or greater in the next year (this is always true).
- What will cause it? Nobody can tell in advance. It really does not matter. You can only see the past.
- When exactly? Nobody knows. Run from anyone who tells you they know exactly when it will happen.
- On average, since 1928, stocks have declined by 10% or more about once each year. It is a normal part of the process…..it is how stocks move….and it is how all that massive stock wealth has been created.
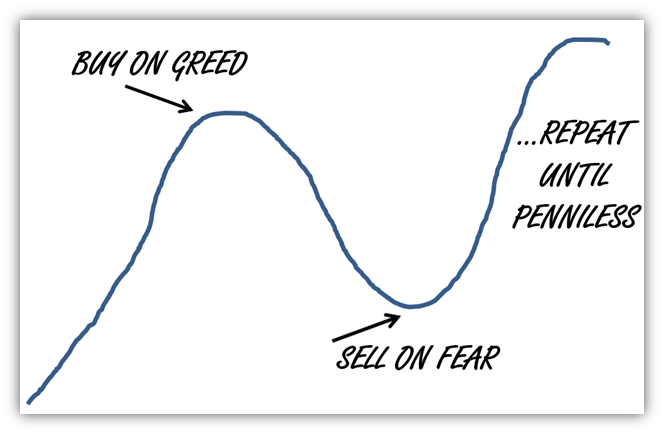
- Ask yourself: “When that routine temporary 10%+ decline comes, can I handle it without doing this?”….

Here is what you don’t want to do:
- Rely on the financial news media, or the predictions of market pundits on TV or the internet
- Rely on your brother-in-law’s (or other relatives’) emotional opinions
- Use gut instinct
- Panic, which is just gut instinct turned up to 10
As always, contact our team if you need help or have questions. We will help you.
Author: Rick Wagner
Source: FactSet, Inc. US Stocks = S&P 500 Index US Bonds = Barclays US Aggregate Bond Index US Cash = 1 Year T Bill Index US Real Estate = US Residential Real Estate Index (House Price Index, published by the Federal Housing Finance Agency)
The views expressed herein are those of the author and do not necessarily reflect the views of Raymond James & Associates or its affiliates. All opinions are subject to change without notice. Neither the information provided nor any opinion expressed constitutes a solicitation for the purchase or sale of any security. Past performance is no guarantee of future results.
The investments listed may not be suitable for all investors. Raymond James & Associates recommends that investors independently evaluate particular investments, and encourages investors to seek the advice of a financial advisor. The appropriateness of a particular investment will depend upon an investor's individual circumstances and objectives.
The Standard & Poor's 500 Index is a market capitalization weighted index of the 500 largest U.S. publicly traded companies by market value.
The information has been obtained from sources considered to be reliable, but we do not guarantee that the foregoing material is accurate or complete. Investing involves risk and you may incur a profit or loss regardless of strategy selected, including diversification and asset allocation. Keep in mind that individuals cannot invest directly in any index, and index performance does not include transaction costs or other fees, which will affect actual investment performance. Future investment performance cannot be guaranteed, investment yields will fluctuate with market conditions.


