

Relative value metrics
- Markets & Investing
- Commentary
Drew O’Neil discusses fixed income market conditions and offers insight for bond investors.
Several indicators used by fixed income investors to measure value have recently taken a positive turn, potentially flashing an entry-point opportunity for investors with money to put to work. While the trends outlined below highlight relative value metrics in both the corporate and municipal markets, also keep in mind that absolute yield levels available for the past several years have been considerably higher than they have been for most of the past 15+ years.
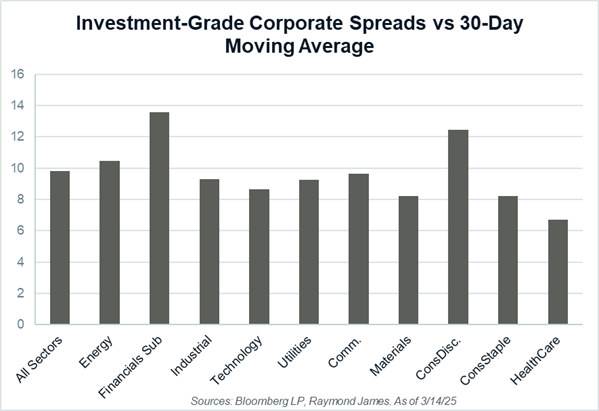
The difference between a corporate bond’s yield and the yield of the Treasury with a similar maturity is its spread. Spread represents the additional yield that an investor receives in return for taking on the additional credit risk that comes with loaning money to a corporation versus loaning money to the US government. In general, the wider (higher) a spread is, the more perceived risk the market is pricing into a bond. For example, AA-rated bonds should trade at tighter (smaller) spreads than BBB-rated bonds. Over the past 2.5 years, investment-grade corporate spreads have been steadily decreasing and as recently as mid-February, were near their lowest levels of the past 15+ years.
Over the past month, corporate spreads have begun to widen, thus increasing their yield pickup over Treasuries. With Treasury yields offering some of the most attractive yields in the past two decades, the increase in spread over Treasury yields presents investors with an opportunity to lock in attractive levels of income. The chart to the right illustrates this recent trend. Current spreads are wider than their 30-day moving average across all sectors of the investment-grade corporate bond market by an average of ~10 basis points. To provide some context, this chart was showing negative values over most of the past 2 years, meaning spread levels were lower than recent averages.
Relative value in the municipal market has also seen a recent shift in a positive direction. The tools we use to measure this value are different than the corporate bond market to account for the tax-exempt status of municipals, but the story is very similar. A common metric used to evaluate how attractive municipal bonds are compared to their taxable counterparts is looking at municipal/Treasury ratios. Specifically, this is the AAA municipal bond yield divided by the Treasury yield of the same maturity. For example, if the AAA municipal yield was 1.50% and the corresponding Treasury yield was 2.00%, the municipal/Treasury ratio would be 75% (1.50 ÷ 2.00 = 75%). In general, the higher the ratio, the more attractive municipal bonds are relative to taxable bonds.

The chart to the left shows the municipal/Treasury ratios for both the 10- and 30-year maturities. The dashed lines represent the current ratio going back over the past year, for comparison over time. A few things to note from this chart. First, notice the spike higher in recent days. There has been a sharp move higher in the relative value of municipals over the past ~2 weeks. Second, ratios are currently at (30-year) or very near (10-year) their highest levels over the past year. This recent move in relative value has pushed municipals to some of their most attractive levels of the past 12 months. And third, the 30-year ratio is significantly higher than the 10-year ratio (90% vs 71%). This highlights the theme that has been in place recently, where intermediate and longer-maturity municipal bonds offer investors the most attractive opportunities. The municipal curve is fairly flat out to ~12 years, at which point it begins to steepen. Longer-maturity municipal bonds offer both good relative value and good absolute yields to investors, especially those in higher tax brackets.
For investors who have money to invest into fixed income, the recent moves we have seen across the market could present a good opportunity to lock in high levels of income in the face of recent volatility. Contact your financial advisor today to discuss current opportunities and how they might fit into your long-term financial plan.
The author of this material is a Trader in the Fixed Income Department of Raymond James & Associates (RJA), and is not an Analyst. Any opinions expressed may differ from opinions expressed by other departments of RJA, including our Equity Research Department, and are subject to change without notice. The data and information contained herein was obtained from sources considered to be reliable, but RJA does not guarantee its accuracy and/or completeness. Neither the information nor any opinions expressed constitute a solicitation for the purchase or sale of any security referred to herein. This material may include analysis of sectors, securities and/or derivatives that RJA may have positions, long or short, held proprietarily. RJA or its affiliates may execute transactions which may not be consistent with the report’s conclusions. RJA may also have performed investment banking services for the issuers of such securities. Investors should discuss the risks inherent in bonds with their Raymond James Financial Advisor. Risks include, but are not limited to, changes in interest rates, liquidity, credit quality, volatility, and duration. Past performance is no assurance of future results.
Investment products are: not deposits, not FDIC/NCUA insured, not insured by any government agency, not bank guaranteed, subject to risk and may lose value.
To learn more about the risks and rewards of investing in fixed income, access the Financial Industry Regulatory Authority’s website at finra.org/investors/learn-to-invest/types-investments/bonds and the Municipal Securities Rulemaking Board’s (MSRB) Electronic Municipal Market Access System (EMMA) at emma.msrb.org.
