SWFG: Retirement Income and Counting Steps
"Statistics do not speak for themselves.”
–Milton Friedman (1912-2006), Economist and Nobel Prize winner

The two images above are from, what my daughter calls, the “free watch.” I received this watch from our health insurer after completing selected activities. After paying $19,000 that year for my family’s health insurance, I did not exactly think of it as my “free watch.” Specifically, these images capture the seemingly identical steps I took on two select days:
- A nine hour hike I took on June 9, 2017 (11,085 steps) in The White Mountains National Forest in New Hampshire and
- A fifty minute run I took on June 16, 2017 (11,108) near my home.
I had the fortune of taking a trip to the White Mountain National Forest in NH in mid-June 2017. The hike on June 9th started at 8:30 AM with a climb of 3,000 feet over two miles followed by further ascent of 2.5 miles until we reached 5,200 feet. We completed our 9 mile hike that day by 4:30 PM and I hadn’t bothered to check my watch all day. To my absolute amazement my watch read that I had ONLY walked 11,085 steps. That is impossible I thought. That is almost identical to the number of steps I obtain when I do a typical run of six or seven miles at home. – see image of “The Run – June 16”. There is no chance that these were identical workouts. I expended dramatically more energy on the hike than on my run but according to my watch that didn’t seem to be reflected.
This phenomena reminded me of the art and delicate nature of taking income in retirement. It goes well beyond statistics. Warren and I counsel our clients during their working years on their Marathon Roadmap Plan. This helps ensure that they have saved enough to provide them income over their retirement. But the work they have done is only half finished. The creation of a Marathon Income Plan for these clients, and the adherence to this Plan, are of equal importance so their income lasts, in some instances, over 25 years. The following are common misunderstandings of clients and the public at large on taking income.
1.) The Arithmetic of Loss
As one heads into retirement, what is most disconcerting is the end of their income from their place of employment. Now all their income will be generated through pensions, social security, and income from their portfolio. The difference in the income phase is that regular portfolio withdrawals compound losses. This is the exact opposite when the person was working and they made investments in their 401k during market declines. Chart 1 shows this effect very clearly.
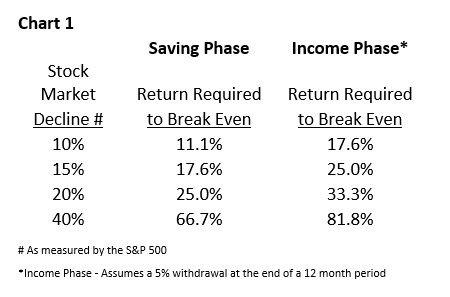
Downturns in client portfolios are a certainty. You should be prepared for the possibility of at least a 20% decline every four to five years. You have heard Warren and I repeat that mantra often. In the income phase, we strive to build portfolios that limit that downside. As I have heard said, “volatility in the savings phase is troubling while volatility in the income phase can be devastating.”
2.) Sequence of Returns
When you are saving money the focus is on your savings rate and the average annual return of your portfolio. Though in the income phase of your life we must be concerned with the timing of those withdrawals. Consider the example of an investor in two different portfolios and their annual returns over a 15 year period.
Portfolio A (%): -9.1, -11.9, -22.2, 28.7, 10.8, 4.7, 15.7, 5.4, -37.2, 27.1, 14.8, 2.0, 15.8, 32.4, 13.8, 1.3
Portfolio B (%): 1.3, 13.8, 32.4, 15.8, 2.0, 14.8, 27.1, -37.2, 5.4, 15.7, 4.7, 10.8, 28.7, -22.2, -11.9, -9.1
You may have already figured out that the annual returns of each portfolio above are simply in inverse order. What you perhaps haven’t figured out is that Portfolio A reflects the annual returns of the S&P 500 from the year 2000 through 2015. Even when one inverts the returns, the average annual return and standard deviation for both portfolios are identical. Therefore, inverting the returns in the savings phase has no effect on the growth of a $500,000 investment. It is the same for both at the end of that difficult period ending 2015 - $944,861. It made no difference to the ending value what the sequence of returns were.
But what if you needed income? Would the results be different? You bet they would! Consider an investor who invests $500,000 and needs $20,000 of income the first year (4%) and an increase of 3% each year thereafter – a total of $403,138 of income. How much would the investor have left?
Portfolio A: $185,095
Portfolio B: $531,656
Portfolio B had almost 3 times more than Portfolio A. How is this possible? Investors in any phase are vulnerable to the market’s random gyrations, but investors in the income phase are even more sensitive to unfortunate timing. Warren and I work hard to try to insulate those in the income phase from downside risk. We can’t eliminate it, but we can reduce it. I think the sign in this picture on our way to summiting Mt. Washington sums up what each investor’s approach should be to the income phase.

The sign reads:
“The area ahead has the worst weather in America. Many have died there from exposure even in the summer. Turn back now if the weather is bad.”
The vast majority of climbers who die when mountaineering perish when descending the mountain they climb, especially Mt. Everest. ^ Be fully prepared. If you don’t know what that means, turn back now and secure a guide.
Thank you for the trust and confidence you have placed in us and giving us the opportunity to provide education to you on your financial journey.
As always, thank you for the introduction of your friends and family that so many of you have made. We are honored to serve you! As a service to our clients, we are happy to act as a sounding board for your friends and family. If any of them should need a second opinion on their financial situation, introduce them to www.striblingwhalen.com or call us at 678-989-0048.
Follow us on Twitter - @brianedwhalen
Regards,
Warren D. Stribling, IV, CFP®
Principal
warren.stribling@striblingwhalen.com
Brian E. Whalen, CFP®, CIMA®
Principal
brian.whalen@striblingwhalen.com
Sources:
^https://www.thoughtco.com/death-on-mount-everest-755907
–“The Math of Getting Back to Even” courtesy of the American Funds
–http://www.macrotrends.net/2526/sp-500-historical-annual-returns
The foregoing information has been obtained from sources considered to be reliable, but we do not guarantee that it is accurate or complete, it is not a statement of all available data necessary for making an investment decision, and it does not constitute a recommendation. Any opinions are those of Brian Whalen and Warren Stribling and not necessarily those of Raymond James. Links are being provided for information purposes only. Raymond James is not affiliated with and does not endorse, authorize or sponsor any of the listed websites or their respective sponsors. Raymond James is not responsible for the content of any website or the collection or use of information regarding any website's users and/or members. Raymond James Financial Services, Inc. does not provide advice on legal issues. These matters should be discussed with the appropriate professional.
Certified Financial Planner Board of Standards Inc. owns the certification marks CFP®, CERTIFIED FINANCIAL PLANNER™ and CFP® in the U.S.
Any opinions are those of Stribling~Whalen Financial Group and not necessarily those of Raymond James. Investing involves risk and you may incur a profit or loss regardless of strategy selected. Past performance does not guarantee future results. Keep in mind that individuals cannot invest directly in any index. The S&P 500 is an unmanaged index of 500 widely held stocks that is generally considered representative of the U.S. stock market.
These are hypothetical examples for illustration purposes only and does not represent an actual investment.
