

Housing, inflation, and America's renters, all have an Airbnb problem
Chief Economist Eugenio J. Alemán discusses current economic conditions.
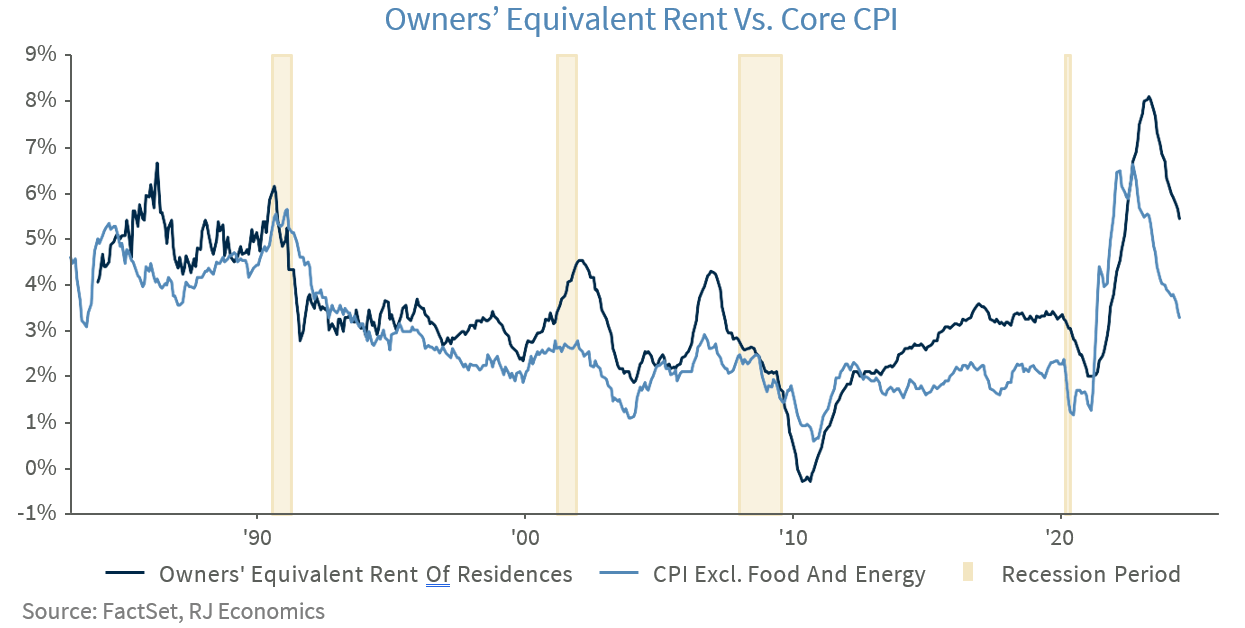
June’s rate of inflation showed, for the first time in several years, an important slowdown in shelter costs, something that economists, us included, have been expecting for a very long time but had not materialized. July’s shelter costs came roaring back and posted a 0.4% month-over-month increase once again, accounting for 90% of the increase in inflation during the month. Typically, shelter costs take a relatively long time to come down due to the way Owner’s Equivalent Rent (OER) is calculated within the Consumer Price Index (CPI). But this time around, as has been the case for other economic indicators after the pandemic, it has been very different.
One potential reason for why shelter costs have remained stubbornly high until now could be related to what economists’ call ‘alternative’ or ‘competitive’ uses. That is, a good or service’s price is intimately related to how many uses that good or service has. One example of a good that often comes to mind regarding ‘alternative uses’ is that of baking soda. We have seen baking soda (or sodium bicarbonate), which is something that is typically used in cooking, also inside closets, and fridges, as a cleaner, weed killer, etc., and according to the website in the footnote below, baking soda has 34 different uses.1 Maybe many of these ‘alternative’ uses for baking soda are not very efficient and/or probably they don’t work at all, but extending a good’s perceived uses has the potential for increasing the demand for a good and thus, the potential for increasing the price of that good, especially if the supply of this good is relatively inelastic. 2
Furthermore, although we could not find any study that showed whether the demand and/or supply of baking soda is elastic or inelastic, it is fair to say that the product is readily available, relatively cheap, and unlikely to face supply constraints. At the same time, it is fair to say that baking soda’s uses face lots of competition from other products. This means that baking soda’s demand and supply are probably highly elastic, that is, a rightward shift in the demand curve produces a small increase in the price of the product. Thus, even if the industry finds alternative uses for a product, the price of that product, in this case, baking soda, is probably not going to increase by much.
However, that is not the case for housing, whose price elasticity of supply is highly inelastic. The supply of homes is almost vertical in the short to medium run, i.e., perfectly inelastic. That is, an increase in the demand for housing increases the price of homes with very little effect on the number of homes available for sale in the short to medium term. This is a reflection of how difficult it is to build a home, how long it takes to construct homes, and how difficult it is, especially in some markets, to get the necessary permits to build, among other constraints.
An increase in the price of existing homes could indeed push current homeowners to put their homes on the market but a homeowner’s decision to sell his/her home is not only dependent on the price of the home but involves many other variables that could keep the supply of existing homes in the market limited. Today’s existing home environment is an example of the difficulties of increasing the supply of existing homes. Today, homeowners with a mortgage in the mid 2% to low 3% interest rate range are unlikely to put their homes on the market because if they do so they would either have to rent at a very high rental price or take a new mortgage at more than double the rate they are currently paying. Thus, unless they are pushed to put their home on the market by, let’s say, ‘life’s unavoidable circumstances,’ they will try to stay put and not try to sell their home.
Furthermore, a new alternative use for housing units that is relatively new has to do with the characteristics of the ‘sharing economy’ or the possibility of renting a room or a home through short-term rental services like Airbnb. Airbnb was created back in 2007 and has taken off since. In fact, several recent studies have indicated that Airbnb has had an effect on the rental market. According to one of these research papers “Airbnb mildly cannibalizes the long-term rental supply. Cities where Airbnb is more popular experience a larger rental supply reduction, but they do not necessarily have a larger percentage of switchers. Affordable units are the major sources of both the negative and positive impacts of Airbnb: they cause a larger rental supply reduction, which harms local renters; they also create a larger market expansion effect, which benefits local hosts who own affordable units and may be less economically advantaged.”3
We are not taking a position on whether Airbnb, or the sharing economy, is good or bad and if it increases or decreases the supply of long-term rentals. We are, however, wondering if the surge in travel after the pandemic recession, together with the access to the sharing economy, have been responsible for the larger lags between a decline in home prices and a deceleration in shelter costs post-pandemic. Since OER depends on rental prices, the increased access to the sharing economy (i.e., Airbnb) may have contributed to keeping OER from slowing at a faster pace during the recovery from the pandemic recession.
According to a recent article by the Washington Post, “Though rent prices nationally have climbed about 19 percent since 2019, prices increased only about 1 percent in the past year, according to a Washington Post analysis of rent data from CoStar Group. That pace is down considerably from the steep price growth seen in 2021 and 2022.”
The unusually strong increase in OER but most importantly, the long time it has taken for OER to come down, is probably related to the strong ‘revenge travel’ after the pandemic recession as well as Americans accessing the sharing economy through Airbnb, which not only contributed to taking some homes off the long-term rental market but has kept rental prices higher for longer.
Today, revenge travel is finally normalizing and thus it seems that this is helping OER to finally come down to earth, which will continue to help the disinflationary process going forward.
1 Annualized Quarter-Over-Quarter Growth
2 Year-Over-Year Percentage Change
3 Upper Bound of the Federal Funds Target Range
Economic and market conditions are subject to change.
Opinions are those of Investment Strategy and not necessarily those of Raymond James and are subject to change without notice. The information has been obtained from sources considered to be reliable, but we do not guarantee that the foregoing material is accurate or complete. There is no assurance any of the trends mentioned will continue or forecasts will occur. Last performance may not be indicative of future results.
Consumer Price Index is a measure of inflation compiled by the US Bureau of Labor Statistics. Currencies investing is generally considered speculative because of the significant potential for investment loss. Their markets are likely to be volatile and there may be sharp price fluctuations even during periods when prices overall are rising.
Consumer Sentiment is a consumer confidence index published monthly by the University of Michigan. The index is normalized to have a value of 100 in the first quarter of 1966. Each month at least 500 telephone interviews are conducted of a contiguous United States sample.
Personal Consumption Expenditures Price Index (PCE): The PCE is a measure of the prices that people living in the United States, or those buying on their behalf, pay for goods and services. The change in the PCE price index is known for capturing inflation (or deflation) across a wide range of consumer expenses and reflecting changes in consumer behavior.
The Consumer Confidence Index (CCI) is a survey, administered by The Conference Board, that measures how optimistic or pessimistic consumers are regarding their expected financial situation. A value above 100 signals a boost in the consumers’ confidence towards the future economic situation, as a consequence of which they are less prone to save, and more inclined to consume. The opposite applies to values under 100.
Certified Financial Planner Board of Standards Inc. owns the certification marks CFP®, CERTIFIED FINANCIAL PLANNER™, CFP® (with plaque design) and CFP® (with flame design) in the U.S., which it awards to individuals who successfully complete CFP Board's initial and ongoing certification requirements.
Links are being provided for information purposes only. Raymond James is not affiliated with and does not endorse, authorize or sponsor any of the listed websites or their respective sponsors. Raymond James is not responsible for the content of any website or the collection or use of information regarding any website's users and/or members.
GDP Price Index: A measure of inflation in the prices of goods and services produced in the United States. The gross domestic product price index includes the prices of U.S. goods and services exported to other countries. The prices that Americans pay for imports aren't part of this index.
The Conference Board Leading Economic Index: Intended to forecast future economic activity, it is calculated from the values of ten key variables.
The Conference Board Coincident Economic Index: An index published by the Conference Board that provides a broad-based measurement of current economic conditions.
The Conference Board lagging Economic Index: an index published monthly by the Conference Board, used to confirm and assess the direction of the economy's movements over recent months.
The U.S. Dollar Index is an index of the value of the United States dollar relative to a basket of foreign currencies, often referred to as a basket of U.S. trade partners' currencies. The Index goes up when the U.S. dollar gains "strength" when compared to other currencies.
The FHFA House Price Index (FHFA HPI®) is a comprehensive collection of public, freely available house price indexes that measure changes in single-family home values based on data from all 50 states and over 400 American cities that extend back to the mid-1970s.
Import Price Index: The import price index measure price changes in goods or services purchased from abroad by U.S. residents (imports) and sold to foreign buyers (exports). The indexes are updated once a month by the Bureau of Labor Statistics (BLS) International Price Program (IPP).
ISM New Orders Index: ISM New Order Index shows the number of new orders from customers of manufacturing firms reported by survey respondents compared to the previous month. ISM Employment Index: The ISM Manufacturing Employment Index is a component of the Manufacturing Purchasing Managers Index and reflects employment changes from industrial companies.
ISM Inventories Index: The ISM manufacturing index is a composite index that gives equal weighting to new orders, production, employment, supplier deliveries, and inventories.
ISM Production Index: The ISM manufacturing index or PMI measures the change in production levels across the U.S. economy from month to month.
ISM Services PMI Index: The Institute of Supply Management (ISM) Non-Manufacturing Purchasing Managers' Index (PMI) (also known as the ISM Services PMI) report on Business, a composite index is calculated as an indicator of the overall economic condition for the non-manufacturing sector.
Consumer Price Index (CPI) A consumer price index is a price index, the price of a weighted average market basket of consumer goods and services purchased by households. Changes in measured CPI track changes in prices over time.
Producer Price Index: A producer price index (PPI) is a price index that measures the average changes in prices received by domestic producers for their output.
Industrial production: Industrial production is a measure of output of the industrial sector of the economy. The industrial sector includes manufacturing, mining, and utilities. Although these sectors contribute only a small portion of gross domestic product, they are highly sensitive to interest rates and consumer demand.
The NAHB/Wells Fargo Housing Opportunity Index (HOI) for a given area is defined as the share of homes sold in that area that would have been affordable to a family earning the local median income, based on standard mortgage underwriting criteria.
The S&P CoreLogic Case-Shiller U.S. National Home Price NSA Index measures the change in the value of the U.S. residential housing market by tracking the purchase prices of single-family homes.
The S&P CoreLogic Case-Shiller 20-City Composite Home Price NSA Index seeks to measures the value of residential real estate in 20 major U.S. metropolitan.
Source: FactSet, data as of 7/7/2023