Sharing knowledge and experiences
“Art enables us to find ourselves and lose ourselves at the same time.”
– Thomas Merton
Do you read the Menu from right to left?
When you go to a restaurant do you read the menu from right-to-left to determine what you’re going to eat? That is, do you look for the cheapest thing on the menu and then decide to eat that?
Boiled turnips?
We find that many investors do just that. They look for the lowest fee investment and choose that, mainly because it’s cheap. A common target for this sort of investing is any of a number of S&P 500 Index funds. But is that the best investment … just because it’s cheap?
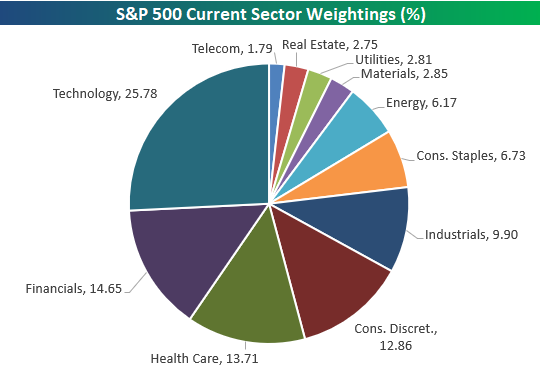
One thing to understand about indexes is that they are what’s called Cap Weighted – a.k.a. Capitalization Weighted. What does that mean? It means that the largest companies have a greater weight in the index (and its performance) and smaller companies in the index have less effect. For instance, the top 5 tech stocks make up 18% of the whole index. Can you guess these 5 companies? Can you also remember the “Tech Bubble” of 1999?
Additionally this can feed into industry weighting (or over weighting) as seen below in the pie graph.

SOURCE: Seeking Alpha – May 10, 2018
One of the risks we are often called to attend to is what is called Concentrated Position risk. Example: We have one client who purchased a company years ago. It went up, split 2:1 (he got two shares of stock for every one that he had – 100 shares became 200 shares). Stock went up some more, split again, went up, split again, etc. etc. Of his $2,500,000 portfolio $1,300,000 (0ver 50% of the portfolio) is in this one stock. The compliance department calls this a concentrated position. It also skews the risk characteristics to the very risky side of the scale which is why compliance has a problem with it.
And yet, as people seek only the cheapest investment they can make this kind of mistake – having too many eggs in one basket. Sure, the index may have adequate performance history … but does it?
Example - From March 2002 to March 2018
S&P 500 Index = 7.72%
Fund A = 8.42%
Fund B = 9.20%
Fund C = 10.12%
Let’s also take a look at these during a particularly bad time for equities – 2015. From Dec 2014 to Dec. 2015.
S&P 500 Index = 1.06%
Fund A = 5.84%
Fund B = 7.63%
Fund C = 8.18%
SOURCE: Sunguard Factmaster
(Used for illustrative purposes only. Funds were chosen at random for use in this illustration.)
See what I mean? Maybe eating at the cheapest restaurant and buying the cheapest thing on the menu isn’t particularly good for your health.
Look, we’re very agnostic about index funds. Use them, don’t use them. In fact, in some cases we do use index funds. But when you go shopping know what you’re buying, or in my analogy so far, know what you’re eating because your financial health could be allergic to it.
Just saying!
Remember, all investments have risk and past performances is not guaranteed into the future.
S&P 500 Total Return Index - The S&P 500 Index Total Return is a broad-based measurement of changes in stock market conditions based on the average performance of 500 widely held common stocks. It consists of 400 industrial, 40 utility, 20 transportation, and 40 financial companies listed on U.S. market exchanges. This is a capitalization-weighted calculated on a total return basis with dividends reinvested. The S&P represents about 75% of the NYSE market capitalization.
Views expressed are not necessarily those of Raymond James & Associates and are subject to change without notice. Information provided is general in nature, and is not a complete statement of all information necessary for making an investment decision, and is not a recommendation or a solicitation to buy or sell any security. No investment strategy can guarantee success.