
Markets are having a sugar rush
Chief Economist Eugenio J. Alemán discusses current economic conditions.
After the first rate cut in two years went according to market expectations as the Federal Reserve (Fed) obliged and reduced the federal funds rate by 50 basis points (bps), markets have continued to run with the Fed’s ball and seem to have a ‘sugar rush,’ betting the Fed is going cut another 50 bps in November and another 25 bps in December for a total of 125 bps before the end of the year. However, the latest Fed dot plot, which was released just one week ago, only called for 100 bps of cuts before the end of the year. Thus, this must mean that markets are expecting economic conditions to deteriorate in the coming months and quarters even though the Fed made its latest changes in the dot plot assuming no change in economic conditions compared to what it had in the June Summary of Economic Projections (SEP).
As we said in last week’s Weekly Economics Thoughts of the Week, the Fed’s argument for its rate cut was that the inflation and labor situation was more in balance than before and that policy rates were too restrictive in this new environment. However, it is clear that markets are second guessing the Fed’s economic forecast and are pushing for more rate cuts. The only way this could happen is if the US economy deteriorates considerably during the last quarter of the year. Recent data is still showing a very strong US economy as consumer demand remains resilient. Furthermore, lower interest rates will probably give some new life to the housing market, helping keep shelter costs high.
We do expect some weakening in economic activity over the next several quarters but probably not enough to warrant the larger decrease in rates that markets are expecting, especially if shelter costs remain high. Thus, if Fed officials want to keep their rate cuts in line with last week’s dot plot, they will have to hit the speaking trail soon to convince markets that what they are expecting is not consistent with what the Fed is seeing in economic activity.
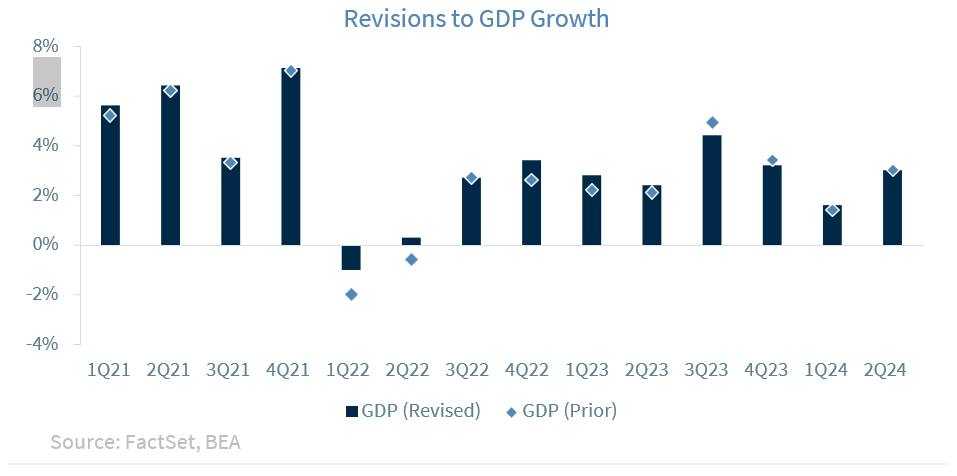
Revisions to GDP: Higher economic growth coming out of the pandemic
During the release of the third revision of the real gross domestic product for the second quarter of the year, the Bureau of Economic Analysis (BEA) revised, mostly upward, the growth rates for GDP in 2021, 2022, and 2023. The revisions were as follows: real GDP growth for 2021 was 6.1% versus an original increase of 5.8%; for 2022 it revised GDP growth from 1.9% originally to 2.5%; and for 2023, it revised GDP growth up from 2.5% to 2.9%.

Perhaps the most important upward revision during this period was related to the first two quarters of 2022, which the BEA had originally declining by 2.0% and 0.6%, respectively. At the time of these releases, there was a big discussion/controversy arguing that those two consecutive quarters of GDP growth should have been declared a technical recession. Now, the controversy is over, as the BEA has revised both quarters up, to a decline of 1.0% during the first quarter of 2022 and an increase of 0.3% during the second quarter of 2022.
Although many sectors of the economy were revised, the most consequential of the changes occurred to personal consumption expenditures (PCE) which, on average, was stronger than originally reported. Since PCE represents about 70% of the U.S. economy, the revisions to PCE pushed economic growth higher.
The bottom line is that consumer demand, and the economy, have continued to outpace even the most upbeat forecast as well as the official releases back to the start of the recovery from the pandemic recession.
Economic and market conditions are subject to change.
Opinions are those of Investment Strategy and not necessarily those of Raymond James and are subject to change without notice. The information has been obtained from sources considered to be reliable, but we do not guarantee that the foregoing material is accurate or complete. There is no assurance any of the trends mentioned will continue or forecasts will occur. Last performance may not be indicative of future results.
Consumer Price Index is a measure of inflation compiled by the US Bureau of Labor Statistics. Currencies investing is generally considered speculative because of the significant potential for investment loss. Their markets are likely to be volatile and there may be sharp price fluctuations even during periods when prices overall are rising.
Consumer Sentiment is a consumer confidence index published monthly by the University of Michigan. The index is normalized to have a value of 100 in the first quarter of 1966. Each month at least 500 telephone interviews are conducted of a contiguous United States sample.
Personal Consumption Expenditures Price Index (PCE): The PCE is a measure of the prices that people living in the United States, or those buying on their behalf, pay for goods and services. The change in the PCE price index is known for capturing inflation (or deflation) across a wide range of consumer expenses and reflecting changes in consumer behavior.
The Consumer Confidence Index (CCI) is a survey, administered by The Conference Board, that measures how optimistic or pessimistic consumers are regarding their expected financial situation. Current Situation Index (CSI) and Future Expectations Index (FEI) are the end-results of CCI, covering economic conditions, employment, price, income, and expense. The reading is 100 plus the average of said five factors
Certified Financial Planner Board of Standards Inc. owns the certification marks CFP®, CERTIFIED FINANCIAL PLANNER®, CFP® (with plaque design) and CFP® (with flame design) in the U.S., which it awards to individuals who successfully complete CFP Board's initial and ongoing certification requirements.
Links are being provided for information purposes only. Raymond James is not affiliated with and does not endorse, authorize or sponsor any of the listed websites or their respective sponsors. Raymond James is not responsible for the content of any website or the collection or use of information regarding any website's users and/or members.
GDP Price Index: A measure of inflation in the prices of goods and services produced in the United States. The gross domestic product price index includes the prices of U.S. goods and services exported to other countries. The prices that Americans pay for imports aren't part of this index.
The Conference Board Leading Economic Index: Intended to forecast future economic activity, it is calculated from the values of ten key variables.
The U.S. Dollar Index is an index of the value of the United States dollar relative to a basket of foreign currencies, often referred to as a basket of U.S. trade partners' currencies. The Index goes up when the U.S. dollar gains "strength" when compared to other currencies.
The FHFA House Price Index (FHFA HPI®) is a comprehensive collection of public, freely available house price indexes that measure changes in single-family home values based on data from all 50 states and over 400 American cities that extend back to the mid-1970s.
The Pending Home Sales Index (PHSI) tracks home sales in which a contract has been signed but the sale has not yet closed.
Supplier Deliveries Index: The suppliers' delivery times index from IHS Markit's PMI business surveys captures the extent of supply chain delays in an economy, which in turn acts as a useful barometer of capacity constraints.
Backlog of Orders Index: The Backlog of Orders Index represents the share of orders that businesses have received but have yet to start or finish. An increasing index value usually indicates growth in business but shows that output is below its maximum potential.
Import Price Index: The import price index measure price changes in goods or services purchased from abroad by
U.S. residents (imports) and sold to foreign buyers (exports). The indexes are updated once a month by the Bureau of Labor Statistics (BLS) International Price Program (IPP).
ISM Services PMI Index: The Institute of Supply Management (ISM) Non-Manufacturing Purchasing Managers' Index (PMI) (also known as the ISM Services PMI) report on Business, a composite index is calculated as an indicator of the overall economic condition for the non-manufacturing sector.
Consumer Price Index (CPI) A consumer price index is a price index, the price of a weighted average market basket of consumer goods and services purchased by households.
Producer Price Index: A producer price index (PPI) is a price index that measures the average changes in prices received by domestic producers for their output.
Industrial production: Industrial production is a measure of output of the industrial sector of the economy. The industrial sector includes manufacturing, mining, and utilities. Although these sectors contribute only a small portion of gross domestic product, they are highly sensitive to interest rates and consumer demand.
The NAHB/Wells Fargo Housing Opportunity Index (HOI) for a given area is defined as the share of homes sold in that area that would have been affordable to a family earning the local median income, based on standard mortgage underwriting criteria.
Conference Board Coincident Economic Index: The Composite Index of Coincident Indicators is an index published by the Conference Board that provides a broad-based measurement of current economic conditions, helping economists, investors, and public policymakers to determine which phase of the business cycle the economy is currently experiencing.
Conference Board Lagging Economic Index: The Composite Index of Lagging Indicators is an index published monthly by the Conference Board, used to confirm and assess the direction of the economy's movements over recent months.
New Export Index: The PMI new export orders index allows us to track international demand for a country's goods and services on a timely, monthly, basis.
Durable Goods: Durable goods orders reflect new orders placed with domestic manufacturers for delivery of long- lasting manufactured goods (durable goods) in the near term or future.
Source: FactSet, data as of 9/20/2024