
Online sales continue to grow, unabated
Chief Economist Eugenio J. Alemán discusses current economic conditions.
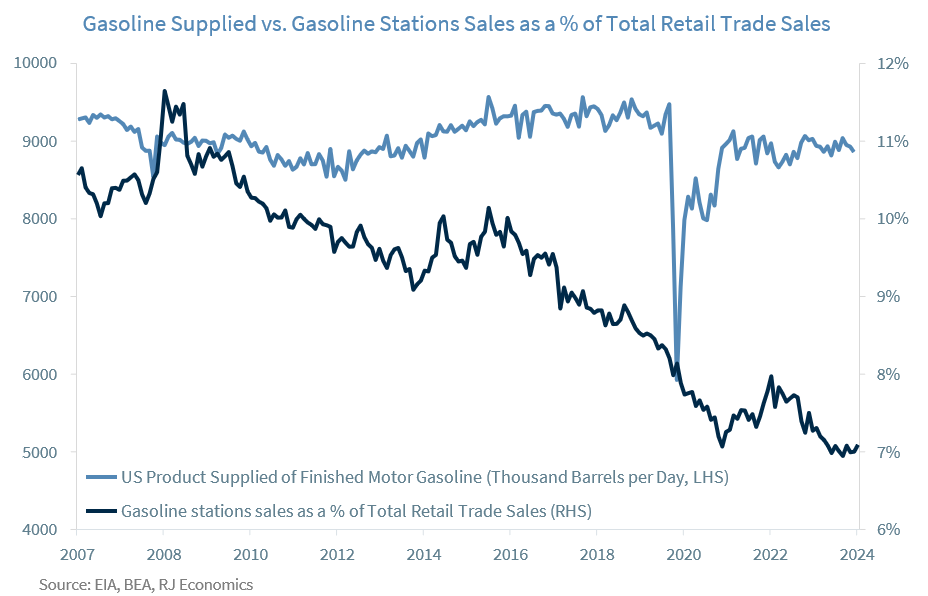
Retail trade sales in the U.S. are reported by distribution channel. For example, gasoline sales are reported through the gasoline stations distribution channel, although those gasoline stations’ sales also include everything else sold at gasoline station convenience stores, i.e., hot dogs, tobacco, sodas, gum, chips, coffee, etc. Furthermore, it is highly unlikely that sales at gasoline stations are going to be threatened by online sales, unless there is something we are missing regarding the need to fill up our tank every week! Nevertheless, gasoline sales as well as gasoline stations sales have remained depressed or at least have remained unchanged over the last few decades or so, perhaps because we continue to buy more efficient cars rather than because we are driving less. The increase in sales of EVs is probably another factor that has helped to increase miles per gallon and why sales of gasoline have not grown over the last several years1. At the same time, gasoline stations’ sales as a percentage of total retail trade sales have continued to lose ground as more efficient cars as well as EV have probably reduced the times Americans are using that distribution channel. Furthermore, gasoline stations, in general, make more profits from convenience stores’ sales than from the sale of gasoline so the reduction in traffic has continued to erode the ability of these gasoline stations to improve their bottom line.
However, other retail distribution channels have also seen something similar to what is happening to the gasoline station distribution channel, but for different reasons. This time it is not more efficient cars or EVs, which at this time do not use the gasoline distribution channel for charging. Most of the challenge faced by these other distribution channels continues to be online sales.
That is, some of these traditional distribution channels, like department stores, furniture stores, general merchandise stores, etc., have been losing ground over the years to the online business distribution channel as online sales have continued to make inroads.
The nonstore distribution channel, which was booming before the pandemic recession, got a further boost during the pandemic recession and has kept on adding sales as well as retail market participation. Nonstore retail sales as a percentage of total retail trade sales represented about 15% before the pandemic, but with the boost from the COVID-19 pandemic, they now represent about 22% of total retail trade sales, as shown by the graph below.
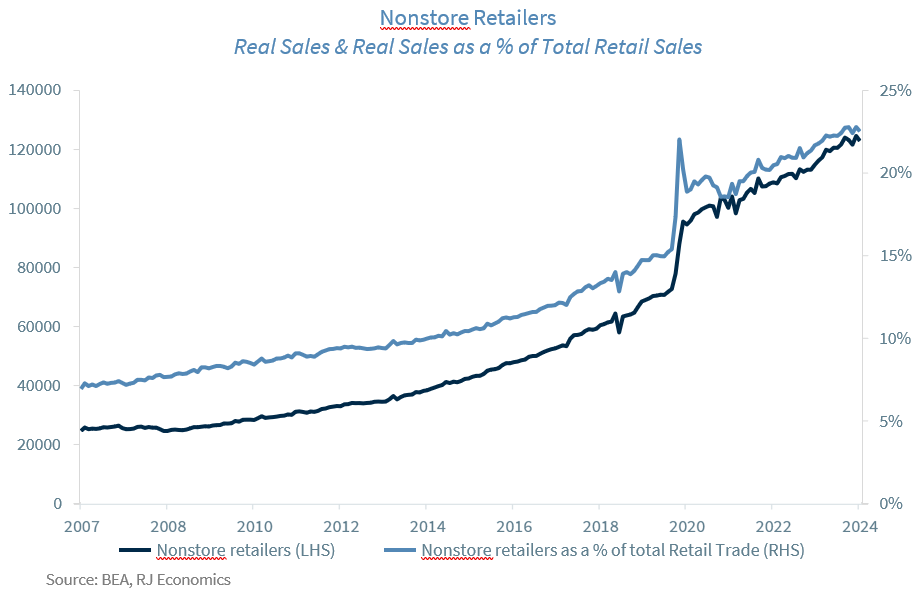
Some of the growth in this distribution channel is certainly coming from other distribution channels but it is also coming from retail trade sales growth. That is, not only is this distribution channel taking from other distribution channels, but it is also growing at a higher rate than the overall retail trade sector, as can be shown in the graph below by comparing the steepness in the nonstore retailers’ sales trend compared to the trend for the overall retail trade sector.

PCE Price Index in line with expectations
This morning’s release of the personal income and expenditure report for May, which included the rate of inflation favored by the Federal Reserve (Fed), the PCE price index, was good news for the Fed but probably not enough to change the institution’s current hawkish stance regarding inflation after the scare it got from the stronger than expected readings during the first quarter of the year.
Looking deeper into the segmentation for the PCE price index shows that the disinflationary environment still has legs, with goods prices in deflationary territory while services prices, although still relatively high, weakened a bit in May. Shelter costs are still keeping services inflation stronger than what everybody had been expecting but even in this sector there is better news coming our way as home prices have started to weaken again as housing inventories, both in the existing home sales market as well as in the new homes sales market, have increased considerably. It is true that any housing price effect is not going to affect shelter costs immediately, but this is probably another added good news for Fed officials who were probably looking ahead for next year’s inflation expectations.
Our forecast for the next several months is for relatively benign inflation numbers, which will help cement Fed officials’ confidence in the staying power of the current disinflationary path and thus we expect them to be able to cut interest rates at least twice during this year.
Economic and market conditions are subject to change.
Opinions are those of Investment Strategy and not necessarily those of Raymond James and are subject to change without notice. The information has been obtained from sources considered to be reliable, but we do not guarantee that the foregoing material is accurate or complete. There is no assurance any of the trends mentioned will continue or forecasts will occur. Last performance may not be indicative of future results.
Consumer Price Index is a measure of inflation compiled by the US Bureau of Labor Statistics. Currencies investing is generally considered speculative because of the significant potential for investment loss. Their markets are likely to be volatile and there may be sharp price fluctuations even during periods when prices overall are rising.
Consumer Sentiment is a consumer confidence index published monthly by the University of Michigan. The index is normalized to have a value of 100 in the first quarter of 1966. Each month at least 500 telephone interviews are conducted of a contiguous United States sample.
Personal Consumption Expenditures Price Index (PCE): The PCE is a measure of the prices that people living in the United States, or those buying on their behalf, pay for goods and services. The change in the PCE price index is known for capturing inflation (or deflation) across a wide range of consumer expenses and reflecting changes in consumer behavior.
The Consumer Confidence Index (CCI) is a survey, administered by The Conference Board, that measures how optimistic or pessimistic consumers are regarding their expected financial situation. A value above 100 signals a boost in the consumers’ confidence towards the future economic situation, as a consequence of which they are less prone to save, and more inclined to consume. The opposite applies to values under 100.
Certified Financial Planner Board of Standards Inc. owns the certification marks CFP®, CERTIFIED FINANCIAL PLANNER™, CFP® (with plaque design) and CFP® (with flame design) in the U.S., which it awards to individuals who successfully complete CFP Board's initial and ongoing certification requirements.
Links are being provided for information purposes only. Raymond James is not affiliated with and does not endorse, authorize or sponsor any of the listed websites or their respective sponsors. Raymond James is not responsible for the content of any website or the collection or use of information regarding any website's users and/or members.
GDP Price Index: A measure of inflation in the prices of goods and services produced in the United States. The gross domestic product price index includes the prices of U.S. goods and services exported to other countries. The prices that Americans pay for imports aren't part of this index.
The Conference Board Leading Economic Index: Intended to forecast future economic activity, it is calculated from the values of ten key variables.
The Conference Board Coincident Economic Index: An index published by the Conference Board that provides a broad-based measurement of current economic conditions.
The Conference Board lagging Economic Index: an index published monthly by the Conference Board, used to confirm and assess the direction of the economy's movements over recent months.
The U.S. Dollar Index is an index of the value of the United States dollar relative to a basket of foreign currencies, often referred to as a basket of U.S. trade partners' currencies. The Index goes up when the U.S. dollar gains "strength" when compared to other currencies.
The FHFA House Price Index (FHFA HPI®) is a comprehensive collection of public, freely available house price indexes that measure changes in single-family home values based on data from all 50 states and over 400 American cities that extend back to the mid-1970s.
Import Price Index: The import price index measure price changes in goods or services purchased from abroad by U.S. residents (imports) and sold to foreign buyers (exports). The indexes are updated once a month by the Bureau of Labor Statistics (BLS) International Price Program (IPP).
ISM New Orders Index: ISM New Order Index shows the number of new orders from customers of manufacturing firms reported by survey respondents compared to the previous month. ISM Employment Index: The ISM Manufacturing Employment Index is a component of the Manufacturing Purchasing Managers Index and reflects employment changes from industrial companies.
ISM Inventories Index: The ISM manufacturing index is a composite index that gives equal weighting to new orders, production, employment, supplier deliveries, and inventories.
ISM Production Index: The ISM manufacturing index or PMI measures the change in production levels across the U.S. economy from month to month.
ISM Services PMI Index: The Institute of Supply Management (ISM) Non-Manufacturing Purchasing Managers' Index (PMI) (also known as the ISM Services PMI) report on Business, a composite index is calculated as an indicator of the overall economic condition for the non-manufacturing sector.
Consumer Price Index (CPI) A consumer price index is a price index, the price of a weighted average market basket of consumer goods and services purchased by households. Changes in measured CPI track changes in prices over time.
Producer Price Index: A producer price index (PPI) is a price index that measures the average changes in prices received by domestic producers for their output.
Industrial production: Industrial production is a measure of output of the industrial sector of the economy. The industrial sector includes manufacturing, mining, and utilities. Although these sectors contribute only a small portion of gross domestic product, they are highly sensitive to interest rates and consumer demand.
The NAHB/Wells Fargo Housing Opportunity Index (HOI) for a given area is defined as the share of homes sold in that area that would have been affordable to a family earning the local median income, based on standard mortgage underwriting criteria.
The S&P CoreLogic Case-Shiller U.S. National Home Price NSA Index measures the change in the value of the U.S. residential housing market by tracking the purchase prices of single-family homes.
The S&P CoreLogic Case-Shiller 20-City Composite Home Price NSA Index seeks to measures the value of residential real estate in 20 major U.S. metropolitan.
Source: FactSet, data as of 7/7/2023