Navigating Uncertainty
By Josh J. Miles
Navigating Uncertainty: The Case for Shifting to Fixed Income and Bonds
As the financial landscape experiences shifts and uncertainties, investors find themselves at a crossroads, contemplating the best strategies to safeguard their portfolios. In this dynamic environment, the age-old question resurfaces: Is now the time to reduce cash allocations and consider adding to bonds or other fixed income opportunities? This blog post delves into the rationale behind an emerging trend – the move towards fixed income and bonds. Analyzing key market insights, economic risks, and opportunities, we explore why this shift might be a prudent move for investors navigating the current financial terrain.
The Current Market Landscape
The past two years have witnessed economic uncertainties and interest rate hikes, prompting investors to flock to the perceived safety of cash. However, with the Federal Reserve poised to cut rates and a staggering $5.6 trillion parked in money market funds as of early September, the landscape is evolving. It's time to consider moving some of that cash back into bonds.
- Think Long Term: The allure of cash in times of economic uncertainty is understandable, yet history teaches us that bonds have consistently outperformed cash over the long term. Looking back to 1990, the Bloomberg U.S. Aggregate has produced nearly double the annual return of cash, with a success rate of outperforming cash in 98% of rolling 5-year periods prior to 2022. The current state of cash yield supremacy is deemed both unprecedented and unsustainable.
- Tardiness Can Be Costly: In the financial realm, timing is everything. Waiting on the sidelines, specifically an all-cash position, can result in missed opportunities. Historical data reveals that during the last four rate-hike cycles, yields peaked before the Fed began cutting rates. Investors who delayed entering the bond market may have left potential returns on the table. Increasing allocations to longer-term bonds now may help mitigate the opportunity cost associated with staying in cash for too long.
Exhibit 1: History shows that yields peak before rate cuts begin.
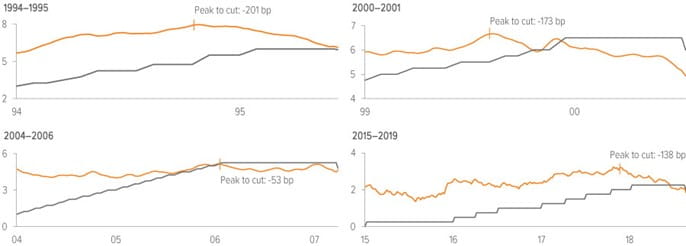
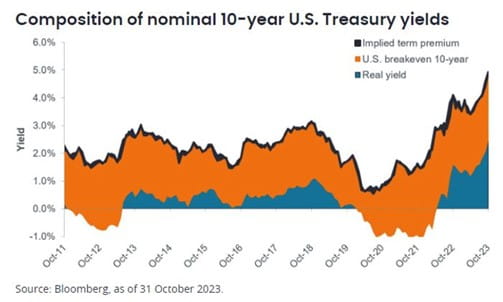
As of 09/01/23. Source: Bloomberg Index Services Limited, Federal Reserve, Voya IM. - Power of Preservation: For the past decade cash and fixed income investments have simply been a store of value and an opportunity cost as they provided little to no return. Today, we are seeing real returns (net of inflation) at levels not seen since before the Great Financial Crisis of 2008-2009. This leads us to seek to increase our allocation to cash and fixed income from three years of spending to up to five years of spending. Recognizing that cash yields will likely not stay at their current levels also has us looking to lock in rates in bonds, CDs or other fixed income opportunities through the next five years.
Economic Risks and Opportunities: Examining economic and market risks and opportunities provides valuable insights into the need for portfolio adjustments.
- Economic Risks:
- Soft Landing Sentiment: The market increase in 2023 attributed to soft landing sentiment may be masking underlying recessionary pre-conditions. Raymond James Chief Investment Officer Larry Adam sees a recession coming in the first half of 2024.1
- Yield Curve Inversion:The yield curve inversion raises concerns as it approaches the length where it traditionally triggers recessions.
- Labor Market Resilience: While labor and employment have held up better than expected, monitoring temporary employment is crucial for early indicators of changes in the labor market. Recent numbers have begun to weaken relative to expectations.
- Market Risks and Opportunities:
- Market Bottoms and Small Caps: Historical data suggests that small caps often lead market recoveries from bottoms, offering insights into overall market health. Small-cap stocks are still lagging their larger counterparts though they have participated fully in the recent market bounce.
- Higher-for-Longer Rates in Many Places: The anticipation of policy rates remaining elevated for an extended period challenges the durability of consumption. Expectations for a central bank pivot in 2024 are becoming more tempered, and the belief that the U.S. economy, among others, has yet to feel the full impact of previous rate hikes adds another layer of complexity.
- Credit Spreads: Well-behaved credit spreads indicate limited stress in the financial system, presenting opportunities for strategic investments. Unlike investment grade fixed income, which has undergone repeated rounds of aggressive selloffs, low-quality corporate bonds have yet to reflect the myriad risks posed by higher interest rates. The spread on high-yield corporates and those of risk-free benchmarks remains below long-term averages. Janus Henderson recommends that investors prioritize quality companies capable of steady cash flows and possessing sound financials as the market enters the later stages of the current cycle.
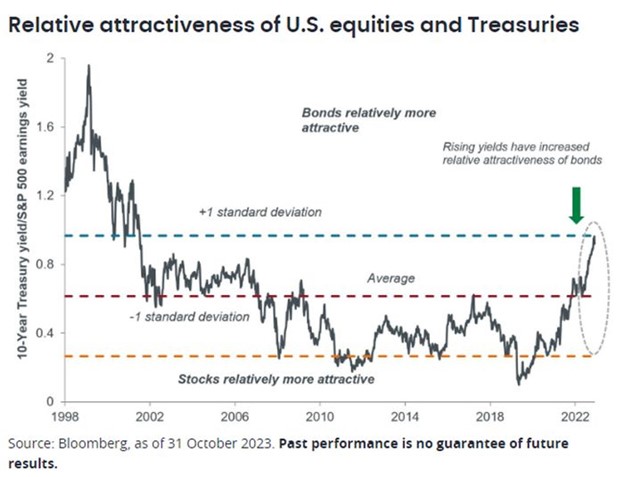
- Relative Attractiveness of Treasuries: Rising yields (declining prices) of bonds has the 10-year treasury looking the most attractive (relative to S&P 500 earnings yield) since 2002. With rates rising across the yield curve, real returns are near 20 year highs across most maturities and bond types (corporate, municipals, etc)
- Diversify: Uncertainty over how long interest rates will stay elevated, coupled with geopolitical risks, is clouding the outlook, creating market volatility. This volatility and uncertainty are causing asset classes like stocks and bonds to occasionally move in tandem. Bonds, however, have the potential to act as ballast to riskier assets in a broad portfolio. Yields have reached levels that offer attractive income potential and possibly lower volatility if rates stay within current ranges. Should a rapidly weakening economy force central banks to pivot, bonds' potential for capital appreciation could offset losses in more cyclically exposed asset classes.
As economic uncertainties persist and the financial landscape evolves, astute investors are re-evaluating their portfolios. Shifting from cash to bonds emerges as a strategic move, supported by historical performance, market signals, and potential opportunities. In this dynamic financial climate, staying informed and adapting to market trends are crucial for successful investment strategies. As we navigate the next 3 to 5 years, the case for fixed income and bonds becomes increasingly compelling.
Of course, each investor has their own goal set and need for liquidity. If you have questions about your specific plan, your cash and fixed income bucket or overall strategic allocation, please reach out to us. Thank you for placing your trust in our team!
Best Regards,

Notes:
1. Raymond James. Quarterly Coordinates – 4Q2024: Sailing on Strange Sees
The information contained in this report does not purport to be a complete description of the securities, markets, or developments referred to in this material. The information has been obtained from sources considered to be reliable, but we do not guarantee that the foregoing material is accurate or complete. Any opinions are those of Josh Miles and not necessarily those of Raymond James. Expressions of opinion are as of this date and are subject to change without notice. There is no guarantee that these statements, opinions or forecasts provided herein will prove to be correct. Holding stocks for the long-term does not insure a profitable outcome. Investing involves risk and you may incur a profit or loss regardless of strategy selected, including asset allocation and diversification. This is not a recommendation to purchase or sell the stocks of the companies pictured/mentioned. Past performance does not guarantee future results. Future investment performance cannot be guaranteed, investment yields will fluctuate with market conditions.
The S&P 500 is an unmanaged index of 500 widely held stocks that is generally considered representative of the U.S. stock market. You cannot invest directly in an index. Index returns do not reflect any fees, expense, or sales charges. These returns were the result of certain market factors and events which may not be repeated in the future.
The Bloomberg Barclays US Aggregate Bond Index covers the investment-grade, US dollar–denominated, fixed-rate taxable bond market, including Treasuries, government-related and corporate securities, MBS, ABS, and CMBS, with maturities of no less than one year. The index is unmanaged and has no fees. One cannot invest directly in an index.
The MSCI All Country World Index (ACWI) is a free-float-adjusted market capitalization weighted index that is designed to measure the equity market performance of developed and emerging markets. The MSCI ACWI consists of 49 country indices comprising 23 developed and 26 emerging market country indices. The index is unmanaged and has no fees. One cannot invest directly in an index.
The MSCI EAFE Index (Europe, Australasia, Far East) is a free-float-adjusted market capitalization index that is designed to measure developed market equity performance, excluding the United States and Canada. The MSCI EAFE Index consists of 21 developed market country indices. The index is unmanaged and has no fees. One cannot invest directly in an index.
The MSCI Emerging Markets Index is a free-float-adjusted market capitalization index that is designed to measure equity market performance in the global emerging markets. The MSCI Emerging Markets Index consists of 26 emerging markets country indices: Argentina, Brazil, Chile, China, Colombia, Czech Republic, Egypt, Greece, Hungary, India, Indonesia, Korea, Malaysia, Mexico, Pakistan, Peru, Philippines, Poland, Qatar, Russia, Saudi Arabia, South Africa, Taiwan, Thailand, Turkey, and United Arab Emirates. The index is unmanaged and has no fees. One cannot invest directly in an index.
The Russell Midcap Index is a subset of the Russell 1000 Index, excluding the largest companies to leave approximately 800 securities designed to represent the “mid cap” portion of the US equity market. (The Russell 1000 Index measures the performance of the large-cap segment of the US equity universe. It includes approximately 1,000 of the largest securities based on a combination of their market cap and current index membership.) The index is unmanaged and has no fees. One cannot invest directly in an index.
The Russell 1000 Value Index measures the performance of those Russell 1000 companies with lower price-to-book ratios and lower forecasted growth values. (The Russell 1000 Index measures the performance of the large-cap segment of the US equity universe. It includes approximately 1,000 of the largest securities based on a combination of their market cap and current index membership.) The index is unmanaged and has no fees. One cannot invest directly in an index.
The Russell 1000 Growth Index measures the performance of those Russell 1000 companies with higher price-to-book ratios and higher forecasted growth values. (The Russell 1000 Index measures the performance of the large-cap segment of the US equity uni¬verse. It includes approximately 1,000 of the largest securities based on a combination of their market cap and current index membership.) The index is unmanaged and has no fees. One cannot invest directly in an index. The Russell 2000 Index is designed to represent the “small cap” market of US equity securities, composed of approximately 2,000 of the smallest securities in the Russell 3000 Index. (The Russell 3000 Index measures the performance of the 3,000 largest US companies, representing most of the investible US equity market.) The index is unmanaged and has no fees. One cannot invest directly in an index.
The Russell 2000 Growth Index measures the performance of the small-cap growth segment of the US equity universe. It includes those Russell 2000 companies with higher price-to-book ratios and higher forecasted growth values. (The Russell 2000 Index is designed to represent the “small cap” market of US equity securities, composed of approximately 2,000 of the smallest securities in the Russell 3000 Index.) The index is unmanaged and has no fees. One cannot invest directly in an index.
An investment cannot be made directly in an index. Indices are unmanaged and have no fees.
Equity securities will fluctuate in price; the value of your investment will thus fluctuate, and this may result in a loss. Securities in certain non-domestic countries may be less liquid, more volatile, and less subject to governmental supervision than in one’s home market. The values of these securities may be affected by changes in currency rates, application of a country’s specific tax laws, changes in government administration, and economic and monetary policy. Small- and mid-capitalization stocks may be subject to higher degrees of risk, their earnings may be less predictable, their prices more volatile, and their liquidity less than that of large-capitalization or more established companies’ securities. Emerging markets securities carry special risks, such as less developed or less efficient trading markets, a lack of company information, and differing auditing and legal standards. The securities markets of emerging markets countries can be extremely volatile; performance can also be influenced by political, social, and economic factors affecting companies in emerging markets countries.
An investment in bonds carries risk. If interest rates rise, bond prices usually decline. The longer a bond’s maturity, the greater the impact a change in interest rates can have on its price. If you do not hold a bond until maturity, you may experience a gain or loss when you sell. Bonds also carry the risk of default, which is the risk that the issuer is unable to make further income and principal payments. Other risks, including inflation risk, call risk, and pre-payment risk, also apply.
The MSCI information may only be used for your internal use, may not be reproduced or redistributed in any form and may not be used as a basis for or a component of any financial instruments or products or indices. None of the MSCI information is intended to constitute investment advice or a recommendation to make (or refrain from making) any kind of investment decision and may not be relied on as such. Historical data and analysis should not be taken as an indication or guarantee of any future performance analysis, forecast, or prediction. The MSCI information is provided on an “as is” basis and the user of this information assumes the entire risk of any use made of this information. MSCI, each of its affiliates, and each other person involved in or related to com¬piling, computing, or creating any MSCI information (collectively, the “MSCI Parties”) expressly disclaims all warranties (including, without limitation, any warranties of originality, accuracy, completeness, timeliness, non-infringement, merchantability, and fitness for a particular purpose) with respect to this information.
