The Tail is Wagging the Dog
By Josh J. Miles
I
On Valentine’s Day my wife asked me to stop by the store on the way home to pick up some strawberries and a few other items for our annual pizza and rom-com movie night with the family. Not a problem, until I came to the produce section and saw that a basket of strawberries (mind you, not the big basket – we are talking like twelve strawberries of average size) cost $11.99. My brain could not comprehend putting the strawberries in my basket, so I texted my wife for help. Surely, she would balk at that crazy price for a few strawberries and ease my guilt for not just buying them. “Am I not worth $12?,” was her reply. Touché. She is worth much more than $12 strawberries! Come to think of it, compared to the dozen roses I saw for $60 on the way into the store, my wife was letting me off the hook by simply requesting a dozen strawberries!
Now, I don’t tell this story to show you how cheap I am (I really am not), but this inflation thing is getting out of control, and I know we all have had a few episodes of sticker shock. In fact, I think we have talked more about eggs in our recent reviews than stocks! Speaking off eggs…
What costs more, the chicken or the egg? This is not a riddle. And the answer has become debatable as eggs become the new poster child for inflation. Egg prices have increased nearly 250% since the $2.00 average per dozen in January of 2022 to the recent price of over $5.00. “Egg-flation” is simply a microcosm of the economic theory of supply/demand curves.1 Simply stated, the supply/demand curve helps predict the price of goods by understanding the price consumers are willing to pay at different levels of supply (how readily available the product is) and demand (how many people want the product). Recent outbreaks of avian flu (bird flu) have wreaked havoc on egg laying birds, reducing production by nearly 30% since January of 2022. As you can see from the chart below, there is a direct relationship in the reduction in supply and the corresponding price in eggs. Eggs are what economists call an inelastic good. As prices rise, demand does not change much which supports the higher prices.

Conversely, at the height of the COVID outbreak in 2020, we actually saw oil futures contracts go negative. This means that those who had oil to sell actually paid to have someone take the oil from them. This is an extreme example of supply/demand forces at work. Remember, nobody was driving. The streets were empty. Most businesses were shuttered. Economic activity had ground to a halt. Thus, oil was not being consumed and we were running out of places to store oil. Companies were leasing oil tanker ships, not to ship oil, but to simply store oil until demand re-emerged. Again, this is an extreme example, but this is also an example of elastic pricing. As demand waned, prices followed.
Inflation is at the heart of what ails the markets, but it is not the cause of the pain we are experiencing at the cash register or in the markets. It is simply a symptom of a larger problem.
II
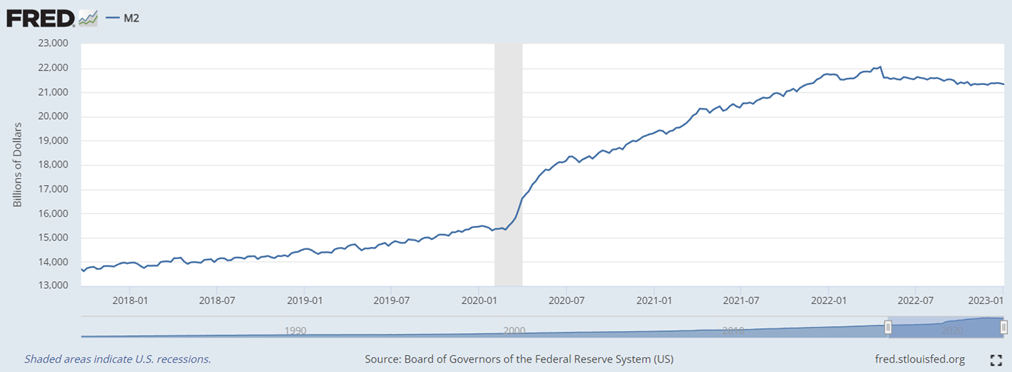
For a deeper understanding of what impacts inflation, we also need to consider the supply of money that is in the economy chasing specific goods and services. Economists look at a measure of money in the economy they dub, M2. M2 is a measure of the total amount of money in an economy. It includes cash in circulation and various types of bank deposits that can be easily converted into cash. A growing M2 indicates an increase in the money supply, which can lead to higher economic growth and inflation if not managed properly by the central bank. For the average person, a growing M2 can lead to higher demand for goods and services, which can drive up prices and potentially reduce the purchasing power of their money. However, it can also lead to increased borrowing and spending, which can boost investment opportunities and potentially drive stock prices higher.
As a response to the global COVID pandemic, we saw central banks around the world respond by lowering interest rates and providing economic incentive plans such as PPP (paycheck protection program) where businesses were given funds to help support their employees during the global shutdown. The result of all this stimulus was a drastic increase in money supply, or M2 (as shown below).

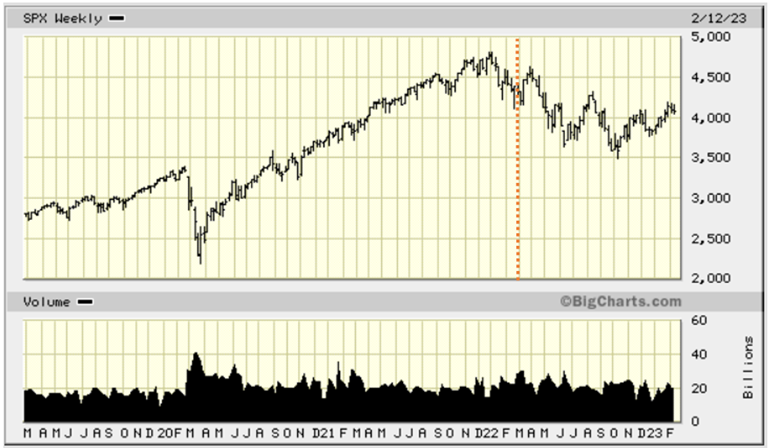
In hindsight, it is easy to see the correlation between the increase in M2 and the response in the capital markets (S&P500 Index price chart shown below).2 The four-week decline at the beginning of the pandemic reduced the index by over 30 percent. Almost as quickly, the market responded to the global stimulus and injection of cash (M2) with a 21-month rally that saw the S&P 500 climb from a low of 2237 to a closing high of 4796 on January 3, 2022. This 114% gain from trough to peak is highly correlated to the 50% increase in M2 money supply during that same stretch.3

III
At their February 1st meeting, the Federal Open Market Committee (FOMC) raised the Fed Funds rate to a target rate of 4.50%-4.75% (a 0.25% increase from the prior rate). FOMC Chair, Jerome Powell did his best to talk the market down with his hawkish tone during his press conference after the announcement. For the time being, the market is not buying what he is selling. However, in the two weeks since the meeting, we have had multiple data points come in that show the economy is still churning out growth and with it, stubborn inflation. This has led many market participants to believe St. Louis Fed President, James Bullard when he says that a half percentage point increase may be needed in March to stem the tide of inflation. As you can see from the Fed Rate Monitor4 below, the probability of a 50 basis point (0.50%) increase is now 21% (up from near zero after the February 1st meeting).

A further tightening is also being priced into the markets with a 72% probability that the Fed raises rates by another quarter percent at the May meeting.

But why are the markets so obsessed with the FOMC and the path of rate hikes? Because they have been the “tail that wags the dog.” There is a widely held view that one must not “fight the Fed” which simply means you want to be cautious when the Fed is raising rates and you want to participate more fully when the Fed is lowering rates. The reason for this is that by raising rates, the Fed is essentially removing liquidity from the markets due to higher borrowing costs and paying banks on their reserves which makes them less likely to freely loan those reserves out. A closer look at the S&P 500 index shows how the market responded to the Fed’s actions. The market began discounting (predicting) that the Fed would have to begin a series of tightening to help combat inflation in early 2022. The Fed ultimately began their tightening in March 2022. This put pressure on the markets for the duration of the year and continues to be one of the key factors for market strategists to consider as they look to the future.

The market will ultimately take its cues from the Fed until they have won the battle against inflation.
IV
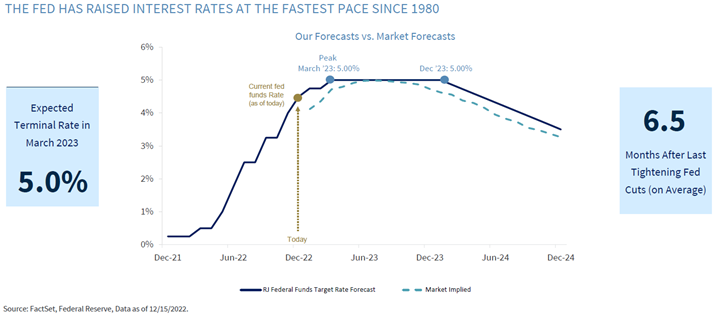
That leaves us with the question of what we expect from the Fed – as that will provide for more clarity on the direction of the overall markets. Prior to the latest CPI report, Raymond James strategists believed that we would see the Fed raise rates to 5.0% in the March meeting and then pause – allowing for the impact of the rate hikes to seep into the economy before beginning an easing of rates in December 2023 or early 2024. Now, as discussed above, we may need two or three more upward tweaks to the target rate before the Fed pauses. This consternation likely keeps the markets on edge and allows for further volatility.

While we do not think we will need to retest the October 2022 lows, we also do not see a clear path to markedly higher markets until the tail takes its place back at the rear of the dog. This will likely take the bulk of 2023 to come to fruition. So, in the meantime, we will continue to monitor the Fed’s progress on inflation for indicators that we are close to the end. If the past serves as a playbook to the future, the market will likely begin its investable march higher well before the economy improves and inflation is fully subdued. This means that I may need to swallow a few more $1 strawberries before we see the end of inflation.
If you have any questions regarding your financial plan or your individual portfolio and how we are addressing the current outlook, please reach out.
Warm Regards,

Notes:
- For a more in depth look at supply/demand curves, please follow this link: supply – demand curves
- Source:com. Trailing 4-yr chart of the S&P 500 Index.
- It's important to note that M2 is just one of many factors that can impact an economy and the financial markets, and it should not be relied on as a sole indicator of future market performance. Investors should consider a variety of factors, including economic data, geopolitical events, and company-specific information, when making investment decisions.
- Source: Investing.com
- Source: JP Morgan. Guide to the Markets. 12/31/2021
The information contained in this report does not purport to be a complete description of the securities, markets, or developments referred to in this material. The information has been obtained from sources considered to be reliable, but we do not guarantee that the foregoing material is accurate or complete. Any opinions are those of Josh Miles and not necessarily those of Raymond James. Expressions of opinion are as of this date and are subject to change without notice. There is no guarantee that these statements, opinions or forecasts provided herein will prove to be correct. Holding stocks for the long-term does not insure a profitable outcome. Investing involves risk and you may incur a profit or loss regardless of strategy selected, including asset allocation and diversification. This is not a recommendation to purchase or sell the stocks of the companies pictured/mentioned. Past performance does not guarantee future results. Future investment performance cannot be guaranteed, investment yields will fluctuate with market conditions.
The S&P 500 is an unmanaged index of 500 widely held stocks that is generally considered representative of the U.S. stock market. You cannot invest directly in an index. Index returns do not reflect any fees, expense, or sales charges. These returns were the result of certain market factors and events which may not be repeated in the future.
The Bloomberg Barclays US Aggregate Bond Index covers the investment-grade, US dollar–denominated, fixed-rate taxable bond market, including Treasuries, government-related and corporate securities, MBS, ABS, and CMBS, with maturities of no less than one year. The index is unmanaged and has no fees. One cannot invest directly in an index.
The MSCI All Country World Index (ACWI) is a free-float-adjusted market capitalization weighted index that is designed to measure the equity market performance of developed and emerging markets. The MSCI ACWI consists of 49 country indices comprising 23 developed and 26 emerging market country indices. The index is unmanaged and has no fees. One cannot invest directly in an index.
The MSCI EAFE Index (Europe, Australasia, Far East) is a free-float-adjusted market capitalization index that is designed to measure developed market equity performance, excluding the United States and Canada. The MSCI EAFE Index consists of 21 developed market country indices. The index is unmanaged and has no fees. One cannot invest directly in an index.
The MSCI Emerging Markets Index is a free-float-adjusted market capitalization index that is designed to measure equity market performance in the global emerging markets. The MSCI Emerging Markets Index consists of 26 emerging markets country indices: Argentina, Brazil, Chile, China, Colombia, Czech Republic, Egypt, Greece, Hungary, India, Indonesia, Korea, Malaysia, Mexico, Pakistan, Peru, Philippines, Poland, Qatar, Russia, Saudi Arabia, South Africa, Taiwan, Thailand, Turkey, and United Arab Emirates. The index is unmanaged and has no fees. One cannot invest directly in an index.
The Russell Midcap Index is a subset of the Russell 1000 Index, excluding the largest companies to leave approximately 800 securities designed to represent the “mid cap” portion of the US equity market. (The Russell 1000 Index measures the performance of the large-cap segment of the US equity universe. It includes approximately 1,000 of the largest securities based on a combination of their market cap and current index membership.) The index is unmanaged and has no fees. One cannot invest directly in an index.
The Russell 1000 Value Index measures the performance of those Russell 1000 companies with lower price-to-book ratios and lower forecasted growth values. (The Russell 1000 Index measures the performance of the large-cap segment of the US equity universe. It includes approximately 1,000 of the largest securities based on a combination of their market cap and current index membership.) The index is unmanaged and has no fees. One cannot invest directly in an index.
The Russell 1000 Growth Index measures the performance of those Russell 1000 companies with higher price-to-book ratios and higher forecasted growth values. (The Russell 1000 Index measures the performance of the large-cap segment of the US equity universe. It includes approximately 1,000 of the largest securities based on a combination of their market cap and current index membership.) The index is unmanaged and has no fees. One cannot invest directly in an index.
The Russell 2000 Index is designed to represent the “small cap” market of US equity securities, composed of approximately 2,000 of the smallest securities in the Russell 3000 Index. (The Russell 3000 Index measures the performance of the 3,000 largest US companies, representing most of the investible US equity market.) The index is unmanaged and has no fees. One cannot invest directly in an index.
The Russell 2000 Growth Index measures the performance of the small-cap growth segment of the US equity universe. It includes those Russell 2000 companies with higher price-to-book ratios and higher forecasted growth values. (The Russell 2000 Index is designed to represent the “small cap” market of US equity securities, composed of approximately 2,000 of the smallest securities in the Russell 3000 Index.) The index is unmanaged and has no fees. One cannot invest directly in an index.
An investment cannot be made directly in an index. Indices are unmanaged and have no fees.
Credit: Callan Associates Inc. and the Callan Periodic Table of Investment Returns
Data Sources: Frank Russell, MSCI, Standard & Poor’s, Bloomberg Barclays Capital (via FactSet, Lipper, Morningstar); MSCI Index returns are net of dividends reinvested with the exception of the MSCI Emerging Markets Index and MSCI ACWI, for which returns are presented gross of dividends reinvested through 1998.
Equity securities will fluctuate in price; the value of your investment will thus fluctuate, and this may result in a loss. Securities in certain non-domestic countries may be less liquid, more volatile, and less subject to governmental supervision than in one’s home market. The values of these securities may be affected by changes in currency rates, application of a country’s specific tax laws, changes in government administration, and economic and monetary policy. Small- and mid-capitalization stocks may be subject to higher degrees of risk, their earnings may be less predictable, their prices more volatile, and their liquidity less than that of large-capitalization or more established companies’ securities. Emerging markets securities carry special risks, such as less developed or less efficient trading markets, a lack of company information, and differing auditing and legal standards. The securities markets of emerging markets countries can be extremely volatile; performance can also be influenced by political, social, and economic factors affecting companies in emerging markets countries.
An investment in bonds carries risk. If interest rates rise, bond prices usually decline. The longer a bond’s maturity, the greater the impact a change in interest rates can have on its price. If you do not hold a bond until maturity, you may experience a gain or loss when you sell. Bonds also carry the risk of default, which is the risk that the issuer is unable to make further income and principal payments. Other risks, including inflation risk, call risk, and pre-payment risk, also apply.
The MSCI information may only be used for your internal use, may not be reproduced or redistributed in any form and may not be used as a basis for or a component of any financial instruments or products or indices. None of the MSCI information is intended to constitute investment advice or a recommendation to make (or refrain from making) any kind of investment decision and may not be relied on as such. Historical data and analysis should not be taken as an indication or guarantee of any future performance analysis, forecast, or prediction. The MSCI information is provided on an “as is” basis and the user of this information assumes the entire risk of any use made of this information. MSCI, each of its affiliates, and each other person involved in or related to compiling, computing, or creating any MSCI information (collectively, the “MSCI Parties”) expressly disclaims all warranties (including, without limitation, any warranties of originality, accuracy, completeness, timeliness, non-infringement, merchantability, and fitness for a particular purpose) with respect to this information.

