Market Mayhem Playbook
Trying times for all of us. When markets are as violent as they are presently, it’s gut wrenching to watch. Unless you were around in 1918, you probably can’t appreciate what some are predicting.
We have a few things going on right now that I'll run through with you. At the end, I’ll give you my playbook moving forward.
- The impact of the virus
- A quick word on energy
- It all comes back to earnings
- Bottoming process
- The next cycle
The Impact of the Virus
If you were able to catch the video conference that Larry Adam held this week, you see that our thought leaders gave 4 different scenarios that they see playing out with the current virus. From a quick spike in cases and a quick recovery to a real doomsday scenario. (If you missed it here is the link to the replay). Fast forward 14 minutes to get to the beginning. These scenarios are important as they provide some substance around how much the economy will ultimately be impacted. They have listed the following 4 scenarios:
- We stop everything (outside essentials) and we are able to contain infections to under 500,000, with a peak number coming towards the end of April.
- Eventually we get it. We take a few weeks and shut down everything (outside of essentials), and we see a peak number of 1 Million infections with the decline in new cases happening by Memorial Day.
- Over 1 Million infections and summer helps us and becomes a buffer with peak new infections happening by July 4th.
- Failure is an option. We don’t take enough action and 1/3 of the population is infected with 1mm deaths.
We think that scenario two is the likely outcome. We are seeing already unprecedented steps by all levels of government.
A Quick Word on Energy
Well in and around all the volatility we have a production war between the two of the the three major oil producers. No agreement can be reached, and the result is an oversupply that drives the price down. My personal view: first the energy index has slowly been becoming a smaller and smaller portion of the overall stock market. Which means that its earnings will have little impact on the overall S&P 500 earnings, what I measure against. Second, I feel that any negative effect on energy earnings will ultimately flow through to the economy in additional discretionary spend. This may take a couple of quarters to play out, however less expensive gas leaves more in the pocket for other things.
It All Comes Back to Earnings
You all know that this is my favorite quote. I’ve said it for as long as I’ve been in the business of investing. In a capitalist society, we are always looking to make money. In normal times it’s easy to put a figure around buying a business. You look at the earnings of that business and place a multiple on those earnings as fair value for the price you are willing to pay. As you well know, things are not always normal. Fear and Greed provide a push and pull effect. It’s at those times you get opportunity. There is no doubt in my mind that earnings will be affected by the shutdown of business, restriction of travel, and just an overall change in the way the consumers operate. Remember, we are a consumer economy. Our spending provides about 70% of the overall economy, so a slowdown will affect the economy in some way, but WE WILL get through this. How quickly we do so is up in the air.
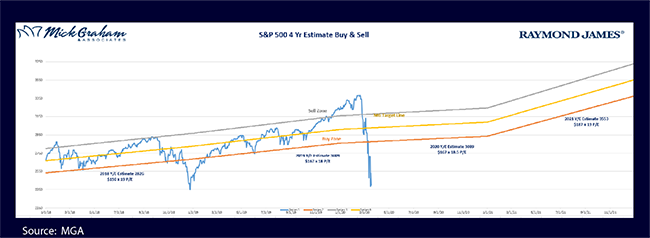
The whole investing universe is lowering their estimates. I changed mine a week or so ago, but honestly it’s near impossible to give you any type of guidance on this or sit here and try to predict what earnings will be this year as the data changes by the second. Instead, I’ll show it to you in the reverse. Reverse is when you put a number around Year over Year GDP and equate that back to earnings. 2009 saw a 2.5% retraction in GDP, and a 30% peak to trough pullback in earnings. If we do that to the current environment, we get a earnings around $130 for S&P 500 apply the longer term multiple (which is lower than current multiples) of 18 times, then you get 2340, which is right around where the market is at the time of writing.
Now I will tell you that’s not anywhere near where I am thinking. I continue to believe that this quarter and next will be negative but will be made up in the third and fourth quarters, to end the year flat. That puts the current level of the market around 21% undervalued. However, as you are seeing, the market is not trading at the moment on fundamentals, it’s trading on fear. So when will it end??
The Bottoming Process

Anyone who tells you they can predict where this market will go from here is either full of “hot air”, or trying to sell you something. From the earnings information above, you could easily assume that the market is cheap (based on earnings). However, that does not mean that it has bottomed, although if wishing made it so. Investor psychology drives a lot of this movement. I’ve showed you the quote before from John Templeton that “bull markets start on pessimism, grow on skepticism, mature on optimism and die on euphoria”. On the other side we have, “bear markets start on euphoria, develop in denial, fast track in fear, are pronounced in panic, and conclude with capitulation.”
I will argue that although this is technically a bear market (being down 20% from all-time highs), it didn’t start on euphoria so is not typical, and as such can bounce back just as quick. However, in case my views turn out to be incorrect, what’s the bottoming process from here? Well I think we are starting to see panic, but not yet capitulation.
From a technical standpoint I want to show you how bottoms generally play out. You see a lot of bad news and big volumes, and spikes in volatility. What we need to see before we can see a bottom is in, is things to stop going lower. (I know that sounds stupid) however when markets are looking to bottom, they need to build a base. Take a look at the chart below from 1957. It was considered a swift bear market. The yellow I highlighted shows that as the volume and volatility remain high, the low days don’t break through the lows that are already put in place.
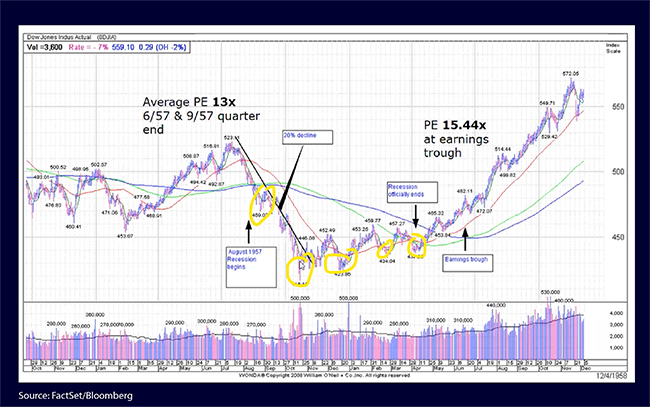
Therefore, at the time of writing we are still making new lows, it tells me that we may not be there yet. We may still be in for a few bad days that can get us to capitulation. What I want you to see from the charts is that this is not a game of getting in or out at the right time, (because it’s near impossible) and destroys more people than it’s ever helped. What’s more important is that there is money to be made as the markets eventually go back up.
The Next Cycle
In most bear markets you generally get a wash out of some sectors that ultimately starts a new cycle, and I think this time is no exception. I believe that after this, we as a society will be more adept to work remotely, shop online, be less reliant on face to face business transactions than ever before. We are starting a new cycle of communication in 5G technology that is a huge upgrade from what we presently have. The Health Care industry is seeing changes from the way we do our regular checkups, through telemedicine, to surgeries done remotely through robotics.
The next cycle has the ability to bring record profits as we can reduce some business costs, increase productivity and reward innovation. Unfortunately, sometimes it takes something bad to happen to motivate the change in behavior that kick starts the next cycle. I for one am excited to see the effects of new technology moving forward, and plan to profit from it.
The Play Book
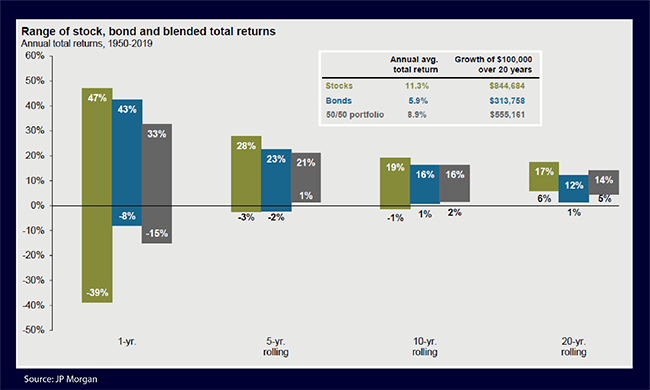
I’m invested for the long term. There has never been a 20-year period that is negative in the S&P 500. It doesn’t matter at what point you start it, from the highest highs move forward 20 years and it will give you a return of between 6%-17%.

Our compliance department dislikes me telling you any specifics related to what I’ve done with the portfolio or what I will do. So, let me just tell you what I believe a portfolio manager worth his weight in staples would do in this market:
- Hold the overall thought that the world is not going to end, and that we will get through this, and the economy will return to normalcy at some point.
- Maintain your asset allocation. As assets move in price they will become less of the portfolio when they go down and more when they go up. Rebalancing to maintain your appropriate allocation when this happens is a prudent strategy.
- Think big picture. Think about the next cycle and how you would position yourself for it.
- Look for opportunity. When the markets go down like they have, it has the ability to drag everything down, the good and the bad.
More specifically, I’m looking to see the number of new cases start to level out. I believe the market will have moved before this happens, so it’s not a timing strategy. China and Korea cases have levelled out; however, Europe and the U.S. are still seeing a large number of increases.
Lastly, I want to show you one more chart.
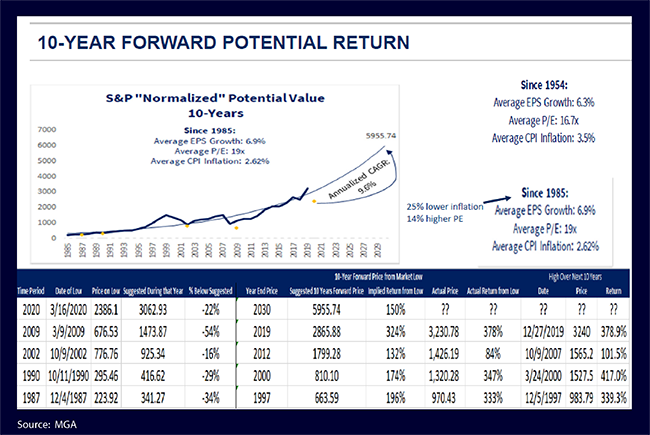
One of the acronyms I like to use is CAGR (Compounded Annual Growth Rate). It’s the return of an investment from one period to another. The chart below can help provide some perspective mainly because its such a long chart. Since 85 Earnings per share growth has been around 6.9%, the curved line on the chart shows you what that would look like. My surprise is how close the market actually trades to the long-term curve. In my opinion, I expect that we will return to the curve again.
Nuclear war was in the cards in some of these times.
With that here is the Buy/Sell. I’m here for you!!
Investing involves risk and you may incur a profit or loss regardless of strategy selected, including diversification and asset allocation. Past performance may not be indicative of future results. This material is being provided for information purposes only and is not a complete description, nor is it a recommendation. Investors should consult their investment professional prior to making an investment decision.

