What History Would Tell Us If Only We Listened
Review, Preview, History, Politics & Opinions Part 3 of 5

“Those who cannot remember the past are condemned to repeat it”, a now famous quote by philosopher George Santayana, written in his book The Life of Reason in 1905. No truer words have been spoken concerning the stock market. Although my favorite quote on history, “History repeats itself, Historians repeat each other”, ranks right up there. In stock market terms, I would replace History with Economy and Historians with Economists. Another of the many jabs I like to give to those that have chosen to look purely at macro level investing without the slightest idea of how to implement their beliefs. By nature, economists study data on a huge scale and attempt to identify underlying economic trends like GDP or unemployment and make forecasts on market cycles. The problem becomes market cycles (as we are seeing now) can sometimes be decades long and this causes a disconnect between capital market movements and economic predictions. I argue that, stock markets in particular only have the ability to look out around 24 months. Anything that is predicted or assumed further out than that although it may be appreciated, is unlikely to move an equity market in any direction for an extended period of time. Human nature will not let us think much longer than that.
What I believe is somewhat predictive, are capitalism and human behavior. Today we have a long history of the stock markets around the world to be able to learn from. Unfortunately, not only do we repeat errors of the past, we forget the reasons we made them in the first place. We forget facts, events, causes and outcomes, and because we forget, we tend to get hyper focused on the here and now. We believe what we see now is different this time, or we rationalize in our brains that the pain of last time wasn’t that bad, or if you’ve never lived through a huge market retreat that there is no reason why double digit returns every year can’t go on forever.
 Why does this happen? It’s simple…we forget. Therefore, we really don’t learn from the past or the mistakes we made. It’s in our DNA to eventually block out painful times, which helps us in so many ways. If it wasn’t, every family would stop at one child! You get my point. With that in mind, I’ll touch on historical returns of the stock market. Although every disclosure you will ever read will say, “Past performance is no indication of future results”, we can use the data to set some reasonable expectations of the future. Forget the truths that you believe in when it comes to the stock market, and certainly forget the myths you know to be true, let’s just purely look at what has happened.
Returns Are Not Normal
The long-term average of the S&P 500 is 11.8% per year. Why can’t we just get that every year and be done with it? Because that’s the cost of risk and return. You know what CDs pay, the difference between that and what the market does is what volatility gives us. Returns are not normal, never have been, never will be. Let’s take a look at some historical returns and see how patterns emerge even through the randomness.
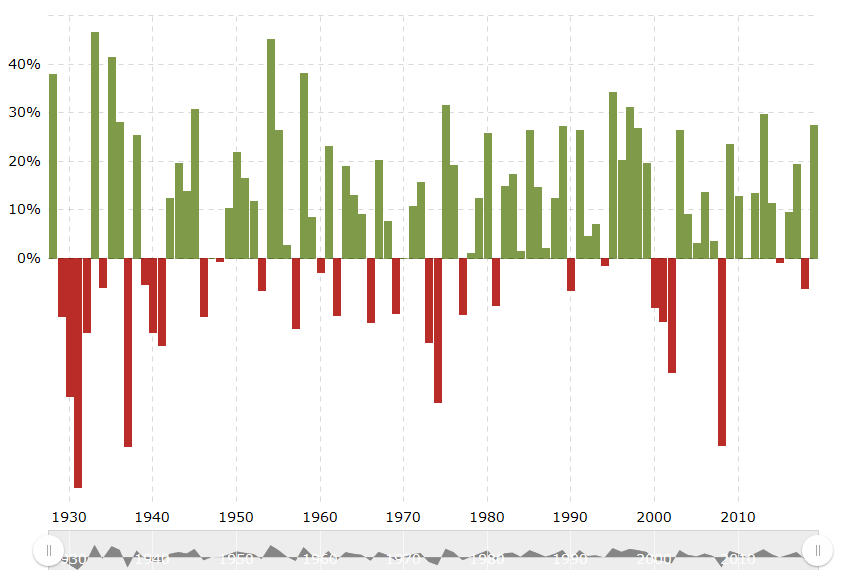
Since 1926 we have had 93 occurrences of an annualized return on the S&P 500. The simple average of these returns is 11.8%. The returns range from -47% to +47%, meaning in any one year the difference in return has been near 100 percentage points. The patterns of these positive returns are random, and although they relate to business cycle, doesn’t mean that it’s predictable in any way. 2018 was a classic example of that, with business tax reform passed and earnings growth at historically high levels, we ended the year in the negative.

Source: Macrotrends
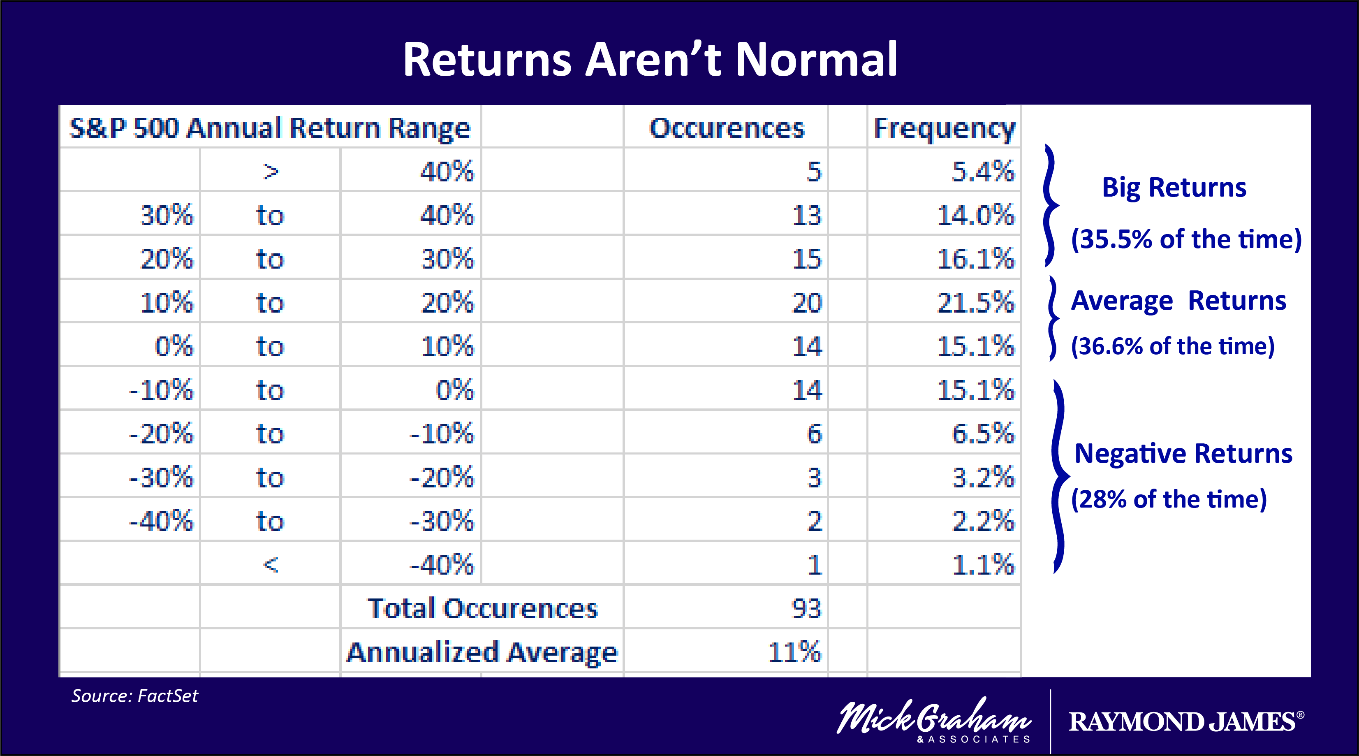
When we look at this a different way you can see a more predictive pattern:
- Equity Markets are positive more than they are negative, in the order of about 2.5 times to 1.
- The most common outcomes are between 0-20%. This happens 36.6% of the time. Closely followed by 20%+ which happens 35.5% of the time.
- Lastly, negative returns happen 28% of the time. This is the least common result when we break it down to three categories.
The chart below breaks it down even further. Down years of 20% or more happen, but rarely. Since 1928 they have happened 6 times. Yes, when they happen it’s excruciating. However, what history does tell us is that when they do happen, they are followed by far greater gains, and more extreme upside.

Market returns are not normal, any term that states otherwise is stated by someone who wants to sell you something or you are the target of George Santayana’s quote. But like most things in society, education and an appreciation of history can guide you to understand that “normal” has a far greater net than you ever thought before.
Time Heals All Wounds
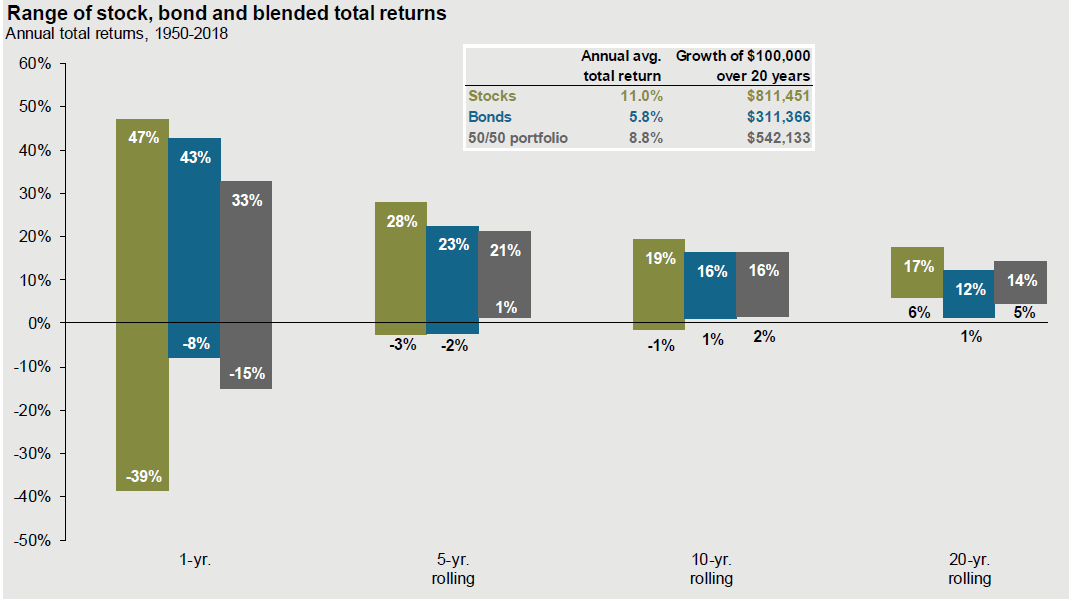
Without doubt, my favorite chart is the one below that shows the narrowing range of returns for the S&P 500 for each calendar year, since 1950. It clearly defines the narrowing of returns over longer periods of time. What starts out in a single year of range of -39% to +47% narrows over a 20-year period of +6% to plus 17% for the stock market. This shows if you did not change strategy and got the maximum down days and the maximum up days, that over any 20-year period since 1950 you made some nice returns.

Source: JPMorgan Funds Guide to the Markets
Returns shown are based on calendar year returns from 1950 to 2018. Stocks represent the S&P 500 Shiller Composite and Bonds represent Strategas/Ibbotson for periods from 1950 to 2010 and Bloomberg Barclays Aggregate thereafter. Growth of $100,000 is based on annual average total returns from 1950 to 2018. Guide to the Markets – U.S. Data are as of September 30, 2019.

Ring the Bell at the Top and Bottom
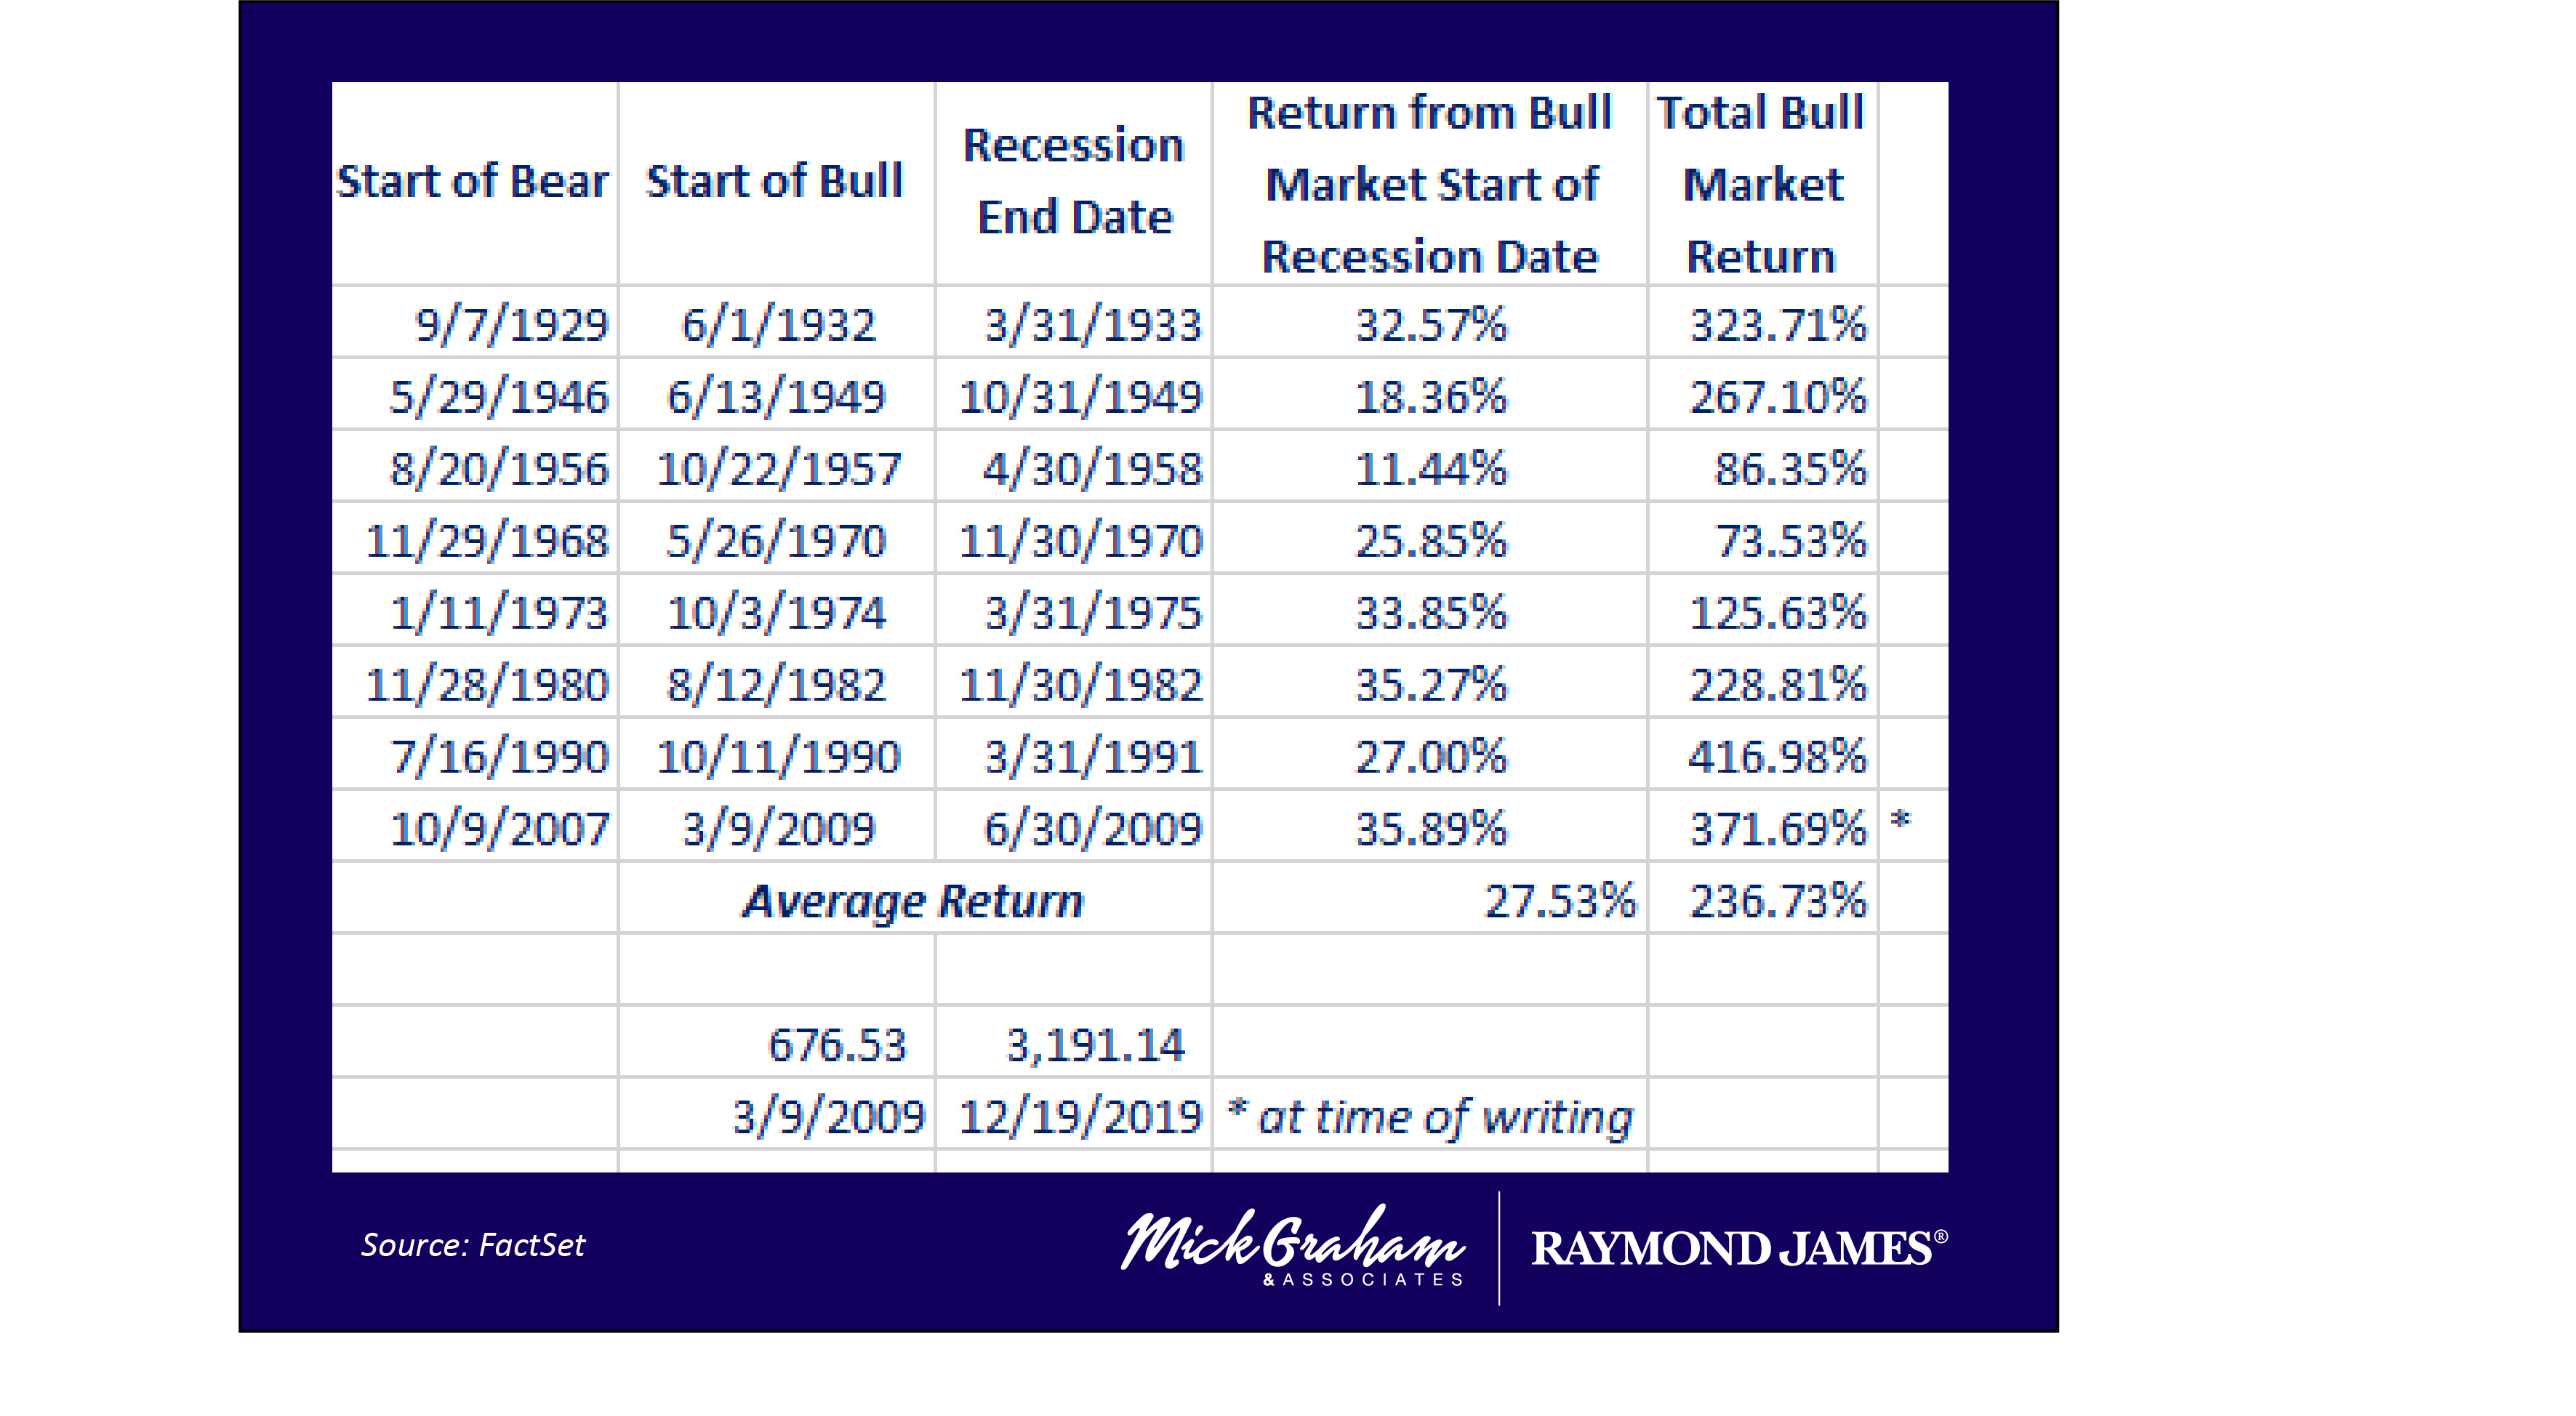
When to get out and when to get in. The R word, “recession” is the equivalent to a shank in golf or an own goal in soccer. It’s the thing we try to avoid at all cost. If only I could get out of the stock market when the recession starts and get back in when it ends, I’d be so far ahead of the curve. In essence, you would be correct, however there are a couple of data points that you need to understand. A recession is classified as two negative quarters of GDP, which means that you don’t know that you’re in one till 6 months after it’s started. Furthermore, historical stats tell us some of the best returns happen a few months prior to the recession ending, and these returns have been huge.
Conclusion
I have about 500 more pages that I could add to the data points above, however in the interests of your sanity, I will not quote them all here today. If you ever can’t sleep and want to go through all the articles on the website, I’m sure I’ve covered a lot of them. The point I’m trying to make in touching on the history of returns is probably not what you think it is. Yes year to date the market is having one of its best years on record, and conventional wisdom would tell you that after a big year like this we are destined for a crappy year next year…however history tells us different, as I touched on a couple of weeks ago.
The past is not predictive; however, history can be used as a research tool that can move confirm or destroy common myths or information that talking heads are spewing out.
 Most importantly, however, is that our mind is a terrible tool in looking forward, especially where emotional bias comes into play. Everyone’s memory is lousy, and over time pain and pleasure get compartmentalized somewhere in the back corner. The easy solution to this is to not use your mind (or heart) in steering investing decisions. That’s for everyone else to do. I’ve heard the saying “Money never forgets”, and I think that is another way of saying, “Our thinking changes over time, but our behavior doesn’t.” It’s the behavior that can cause the problems, but also create the opportunity.
Buy/Sell

Source: MG&A
The foregoing information has been obtained from sources considered to be reliable, but we do not guarantee that it is accurate or complete, it is not a statement of all available data necessary for making an investment decision, and it does not constitute a recommendation. Any opinions are those of Mick Graham not necessarily those of Raymond James.
The S&P 500 is an unmanaged index of 500 widely held stocks that is generally considered representative of the U.S. stock market.
The Bloomberg Barclays US Aggregate Bond Index is a broad-based flagship benchmark that measures the investment grade, US dollar-denominated, fixed-rate taxable bond market.

