2019...An All Star Year?
Review, Preview, History, Politics & Opinions Part 1 of 5

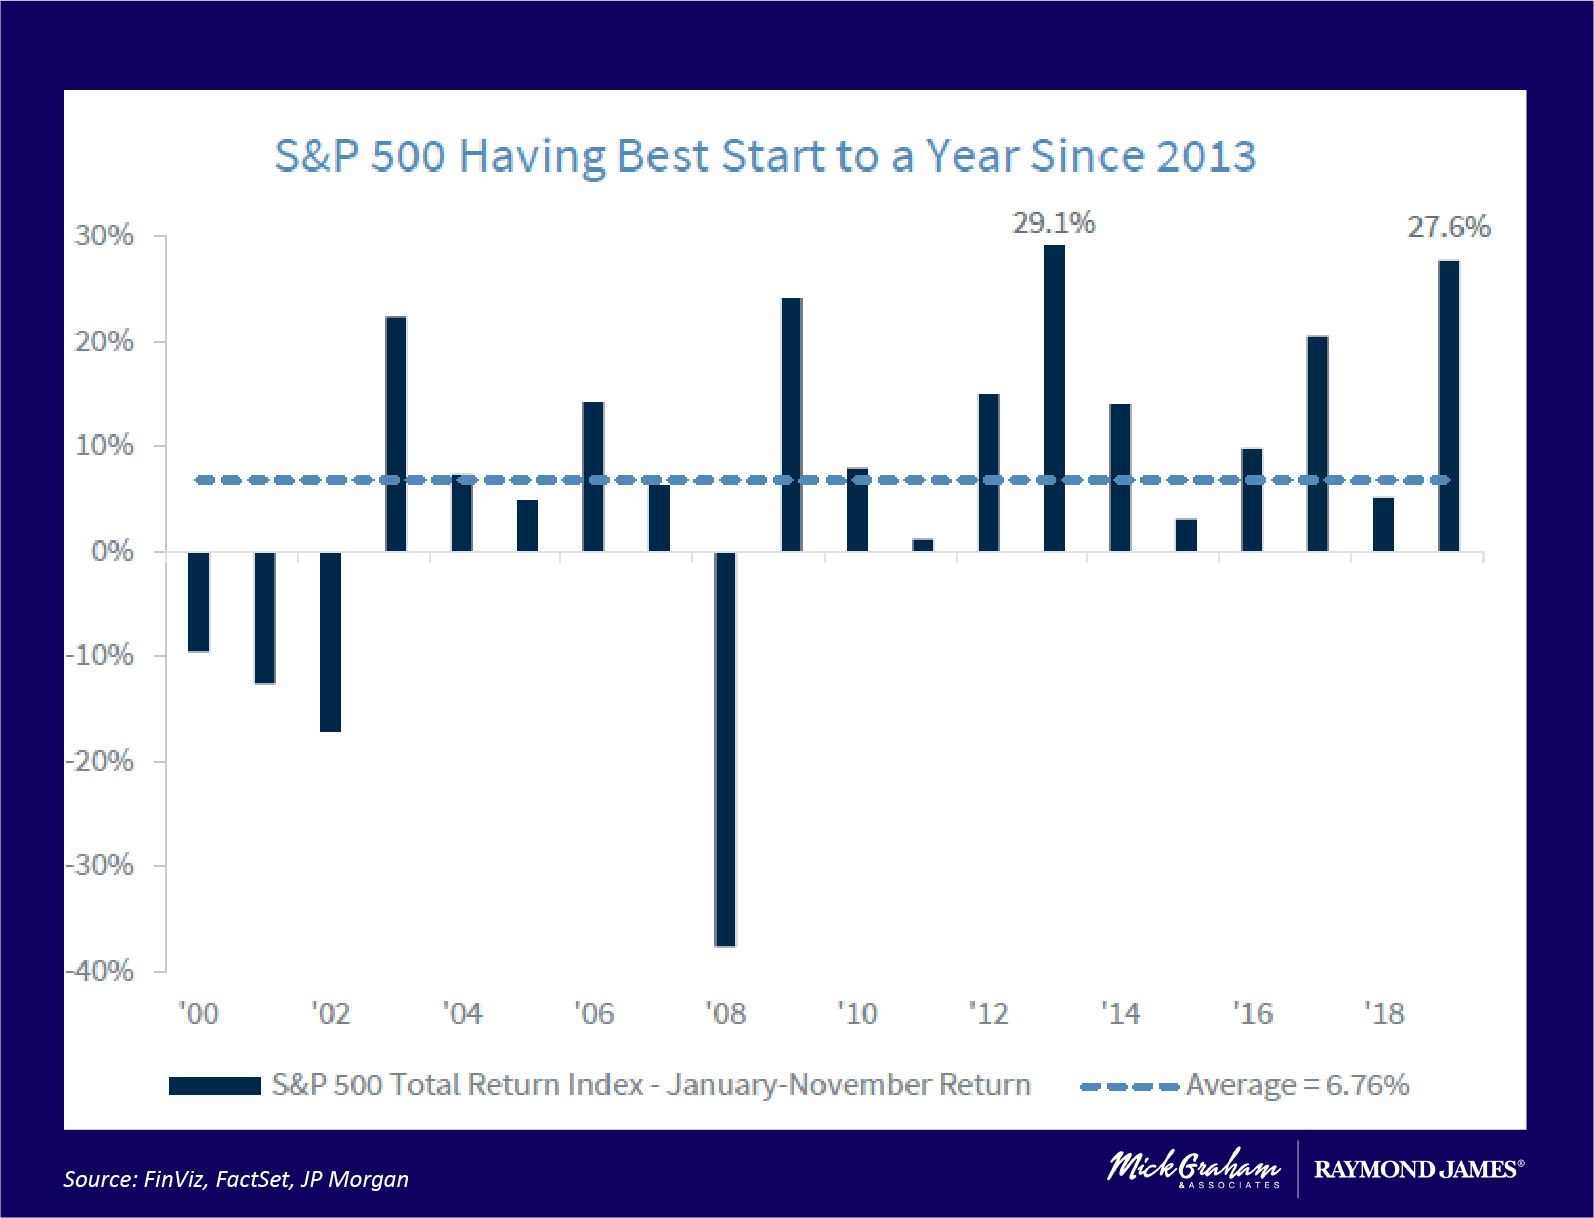
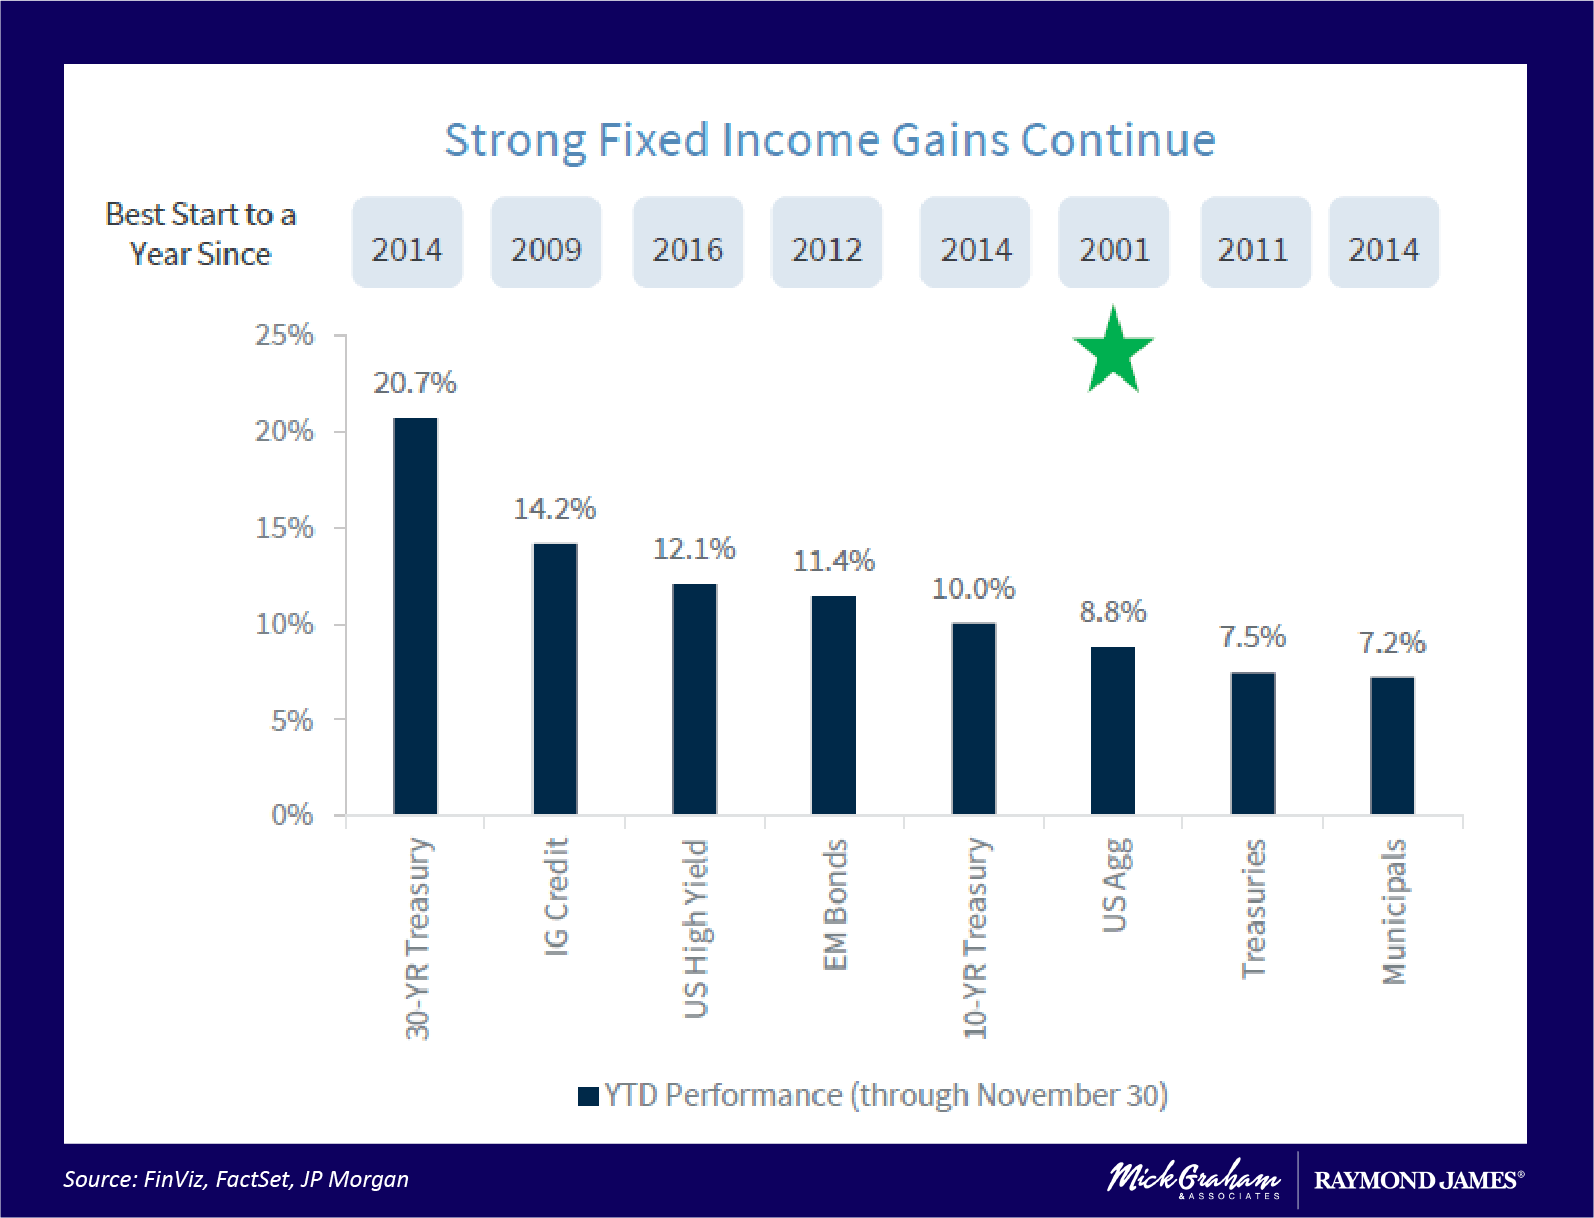
Let’s kick the 3rd to last trading week of the year looking at what has happened in the markets so far. January through November, the S&P 500 is up a whopping 27.6%, which ranks as the best first 11 months since 2013 and ranks in the top 5 since 1945. On the bond (or fixed income side) the Barclays Aggregate (which is the broad bond market index) was up 8.8% for the first 11 months.
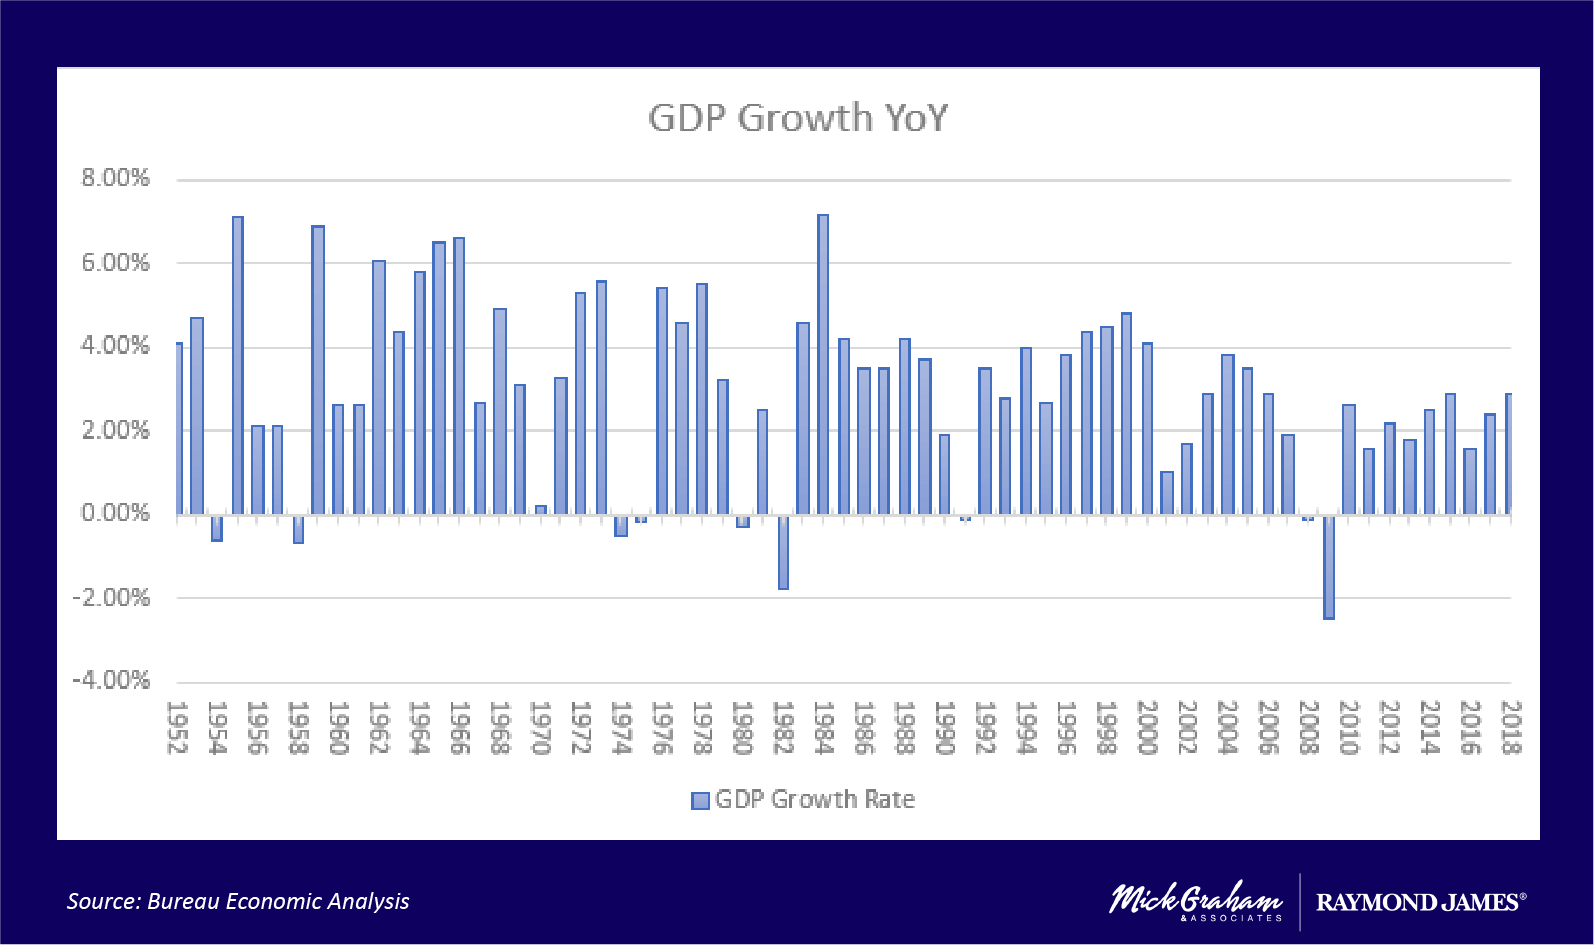
On the economic front, the economy has now grown over 2% for 12 consecutive quarters and has been positive for 10 years since the financial crisis. As good as that sounds, it’s not the longest streak and as the graph shows it has been consistently around the 2% year over year range.
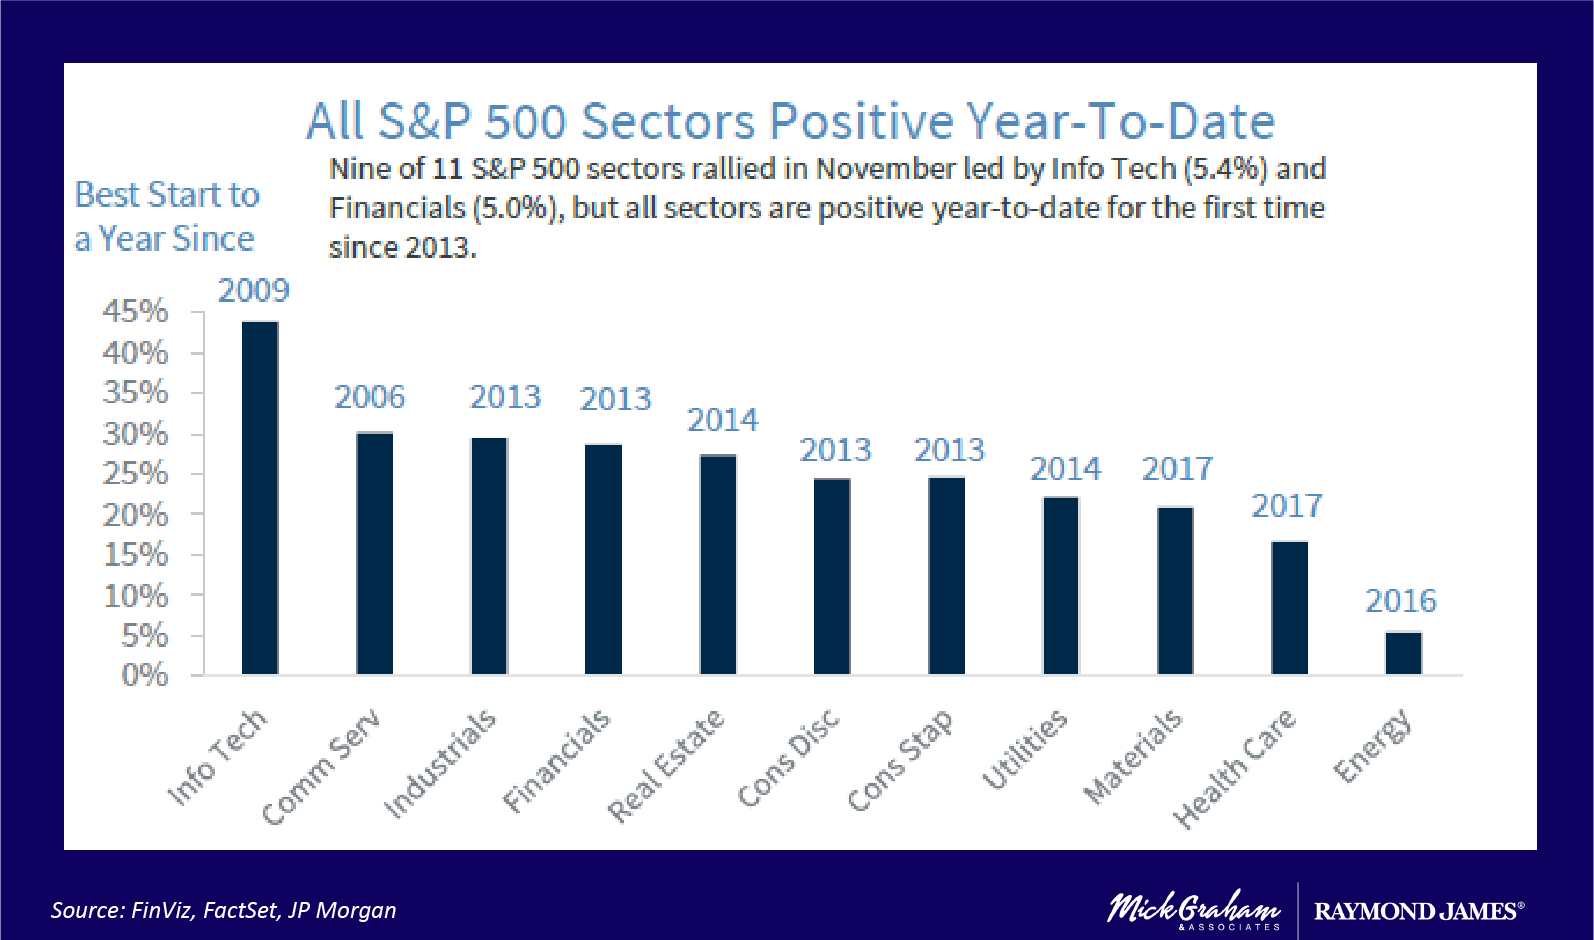
Sectors of the S&P 500 are all positive year to date, including energy. Most of them having their best year since 2013, however Tech (best since 2009) and Communication Services (since 2006).
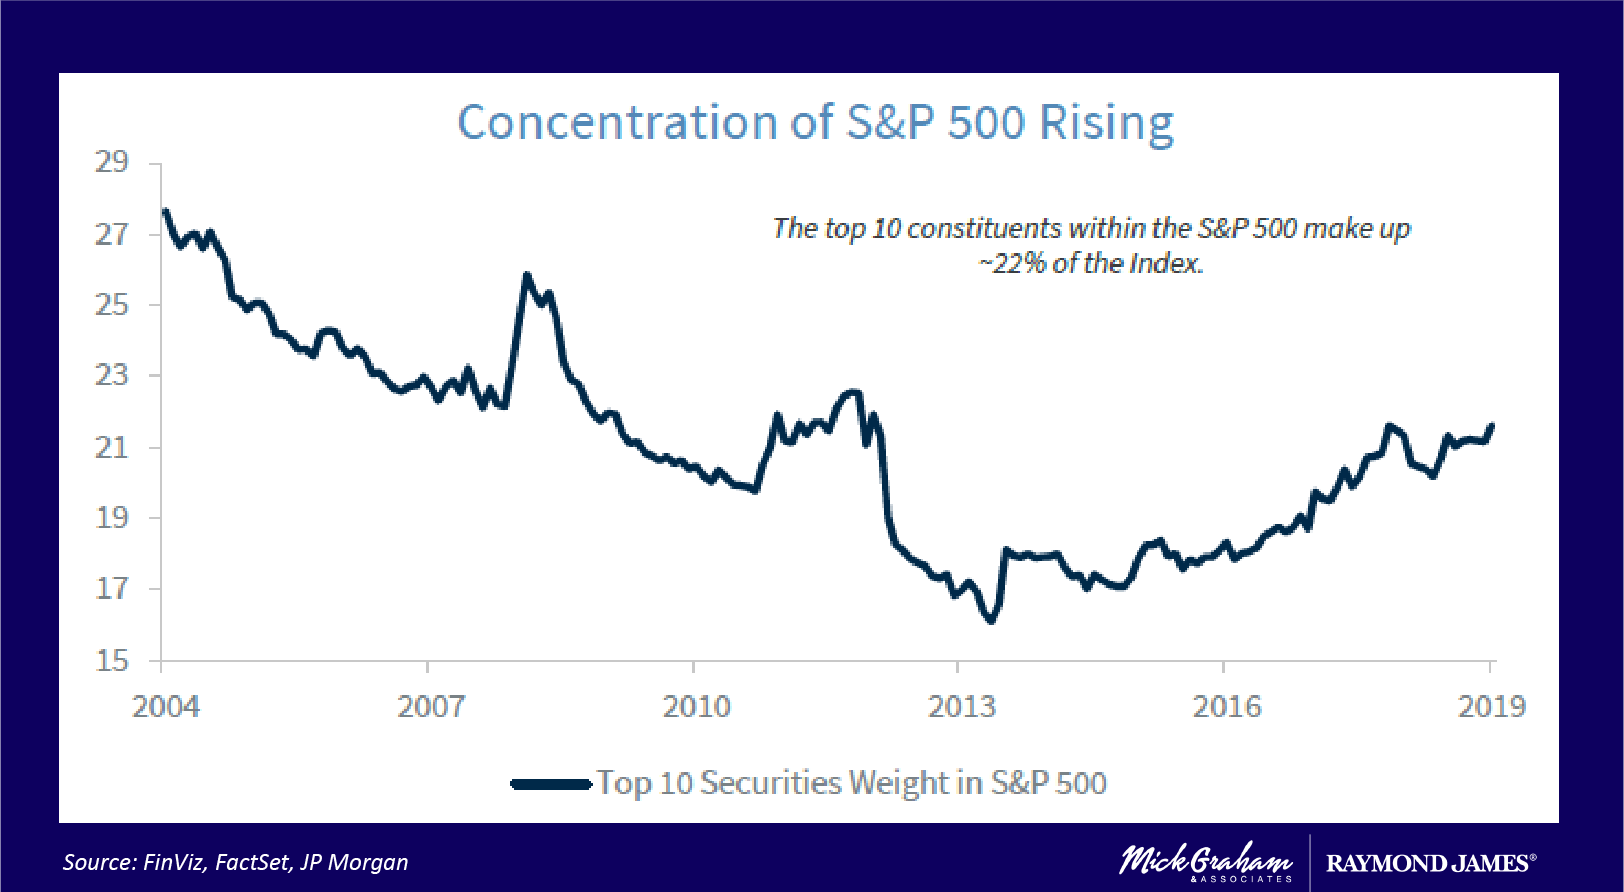
Let’s dig a little deeper and look at what has worked well year to date. What has worked in 2019 is a continuum of what worked in 2018. That was concentration to the largest cap companies. Looking at the top 10 constituents of the S&P 500, firstly you can see from the graph that there has been a consistent concentration since 2013, and to date the top 10 holdings of the S&P 500 forms around 22% of the index. In the last two years the top 10 constituents have outperformed the index by 20% and year to date they have outperformed by 12%.
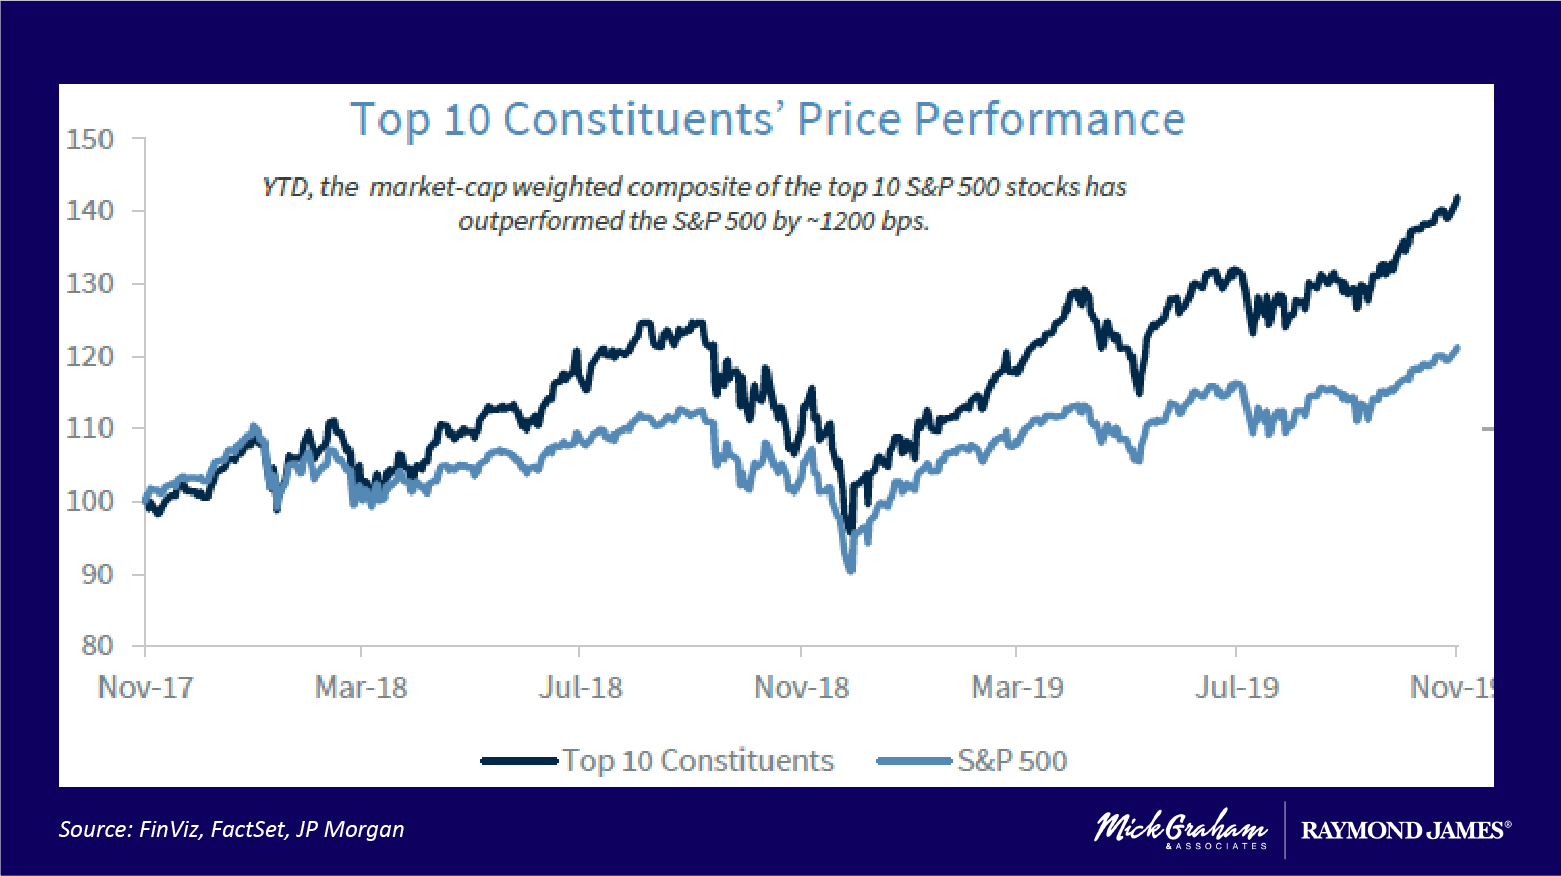
 This has moved the valuation of these companies above the broader index and they now trade at a 25% premium to the overall index. The question becomes, is the premium warranted? The way I measure this is no different to valuing any other position, and that’s looking at fundamental data such as earnings growth. The top 10 have outpaced earnings this year by 5% versus 1.3% for the index and moving forward, the consensus has the top 10 outgrowing estimates by 13% versus 10% (FactSet). This is a classic chicken and egg scenario.
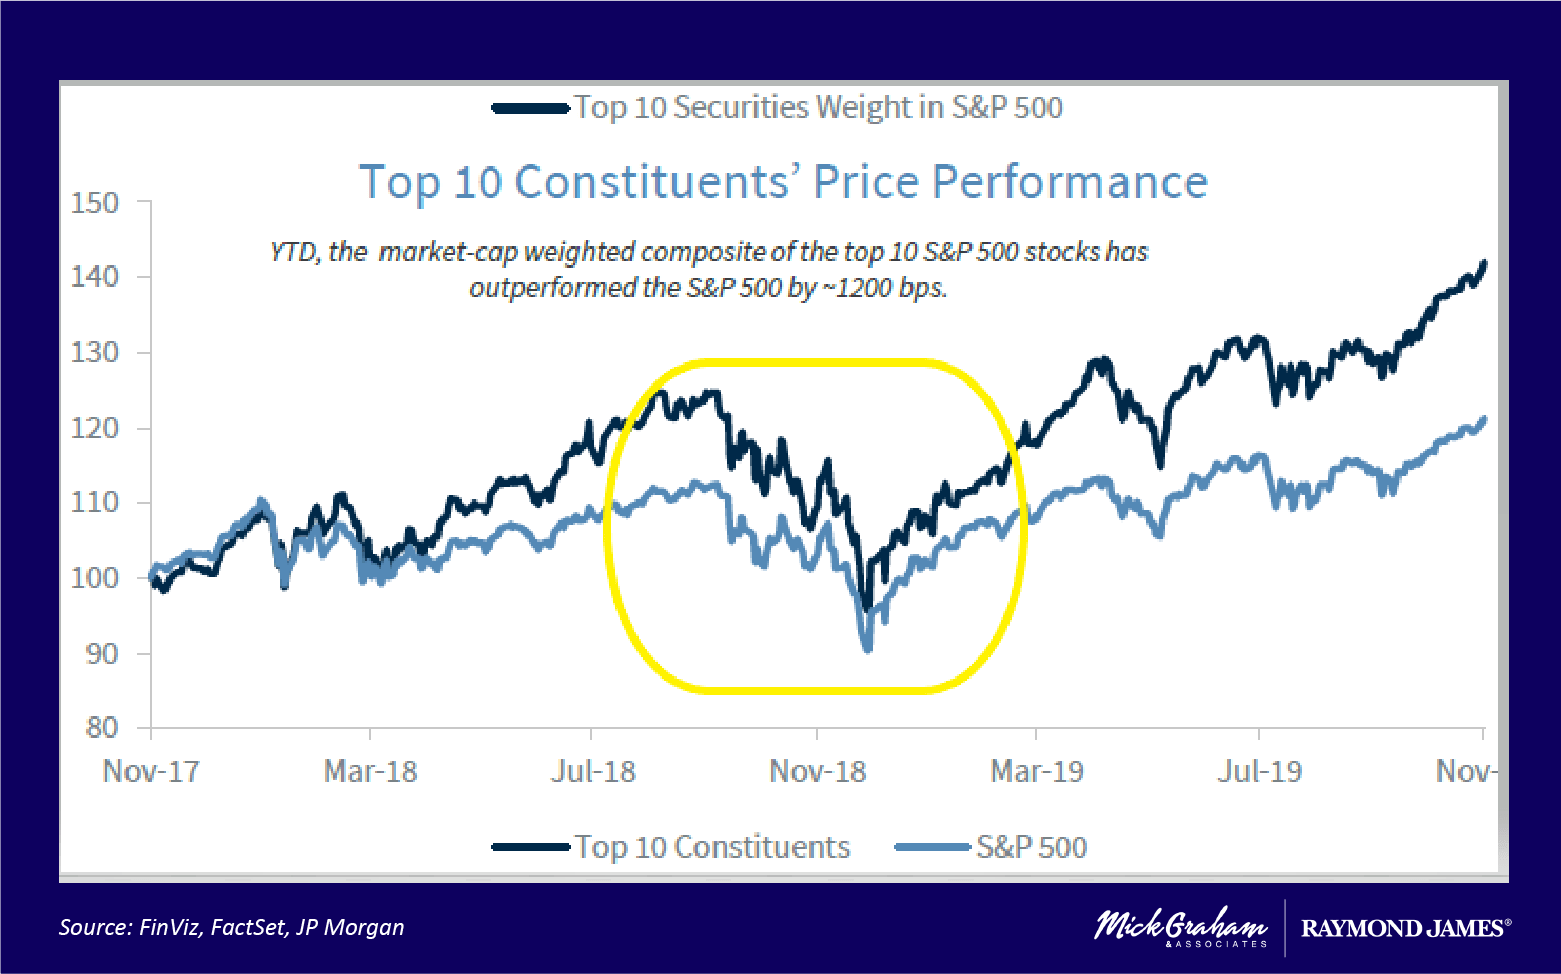
The concentration of the top 10 is relevant, as diversification is one of the best risk reduction strategies a portfolio manager has. The top 10 constituents are split between 6 sectors (11 sectors in the S&P 500). Technology makes up around 43% of the top 10, and you could also argue that Communication Services could be considered technology, that would push the tech sector to around 75%. This becomes concerning when markets retreat as you can see indicated inside the highlighted area. When markets retreat like we saw in the last quarter of 2018, you can see that the top 10 were hit harder than the broad index.

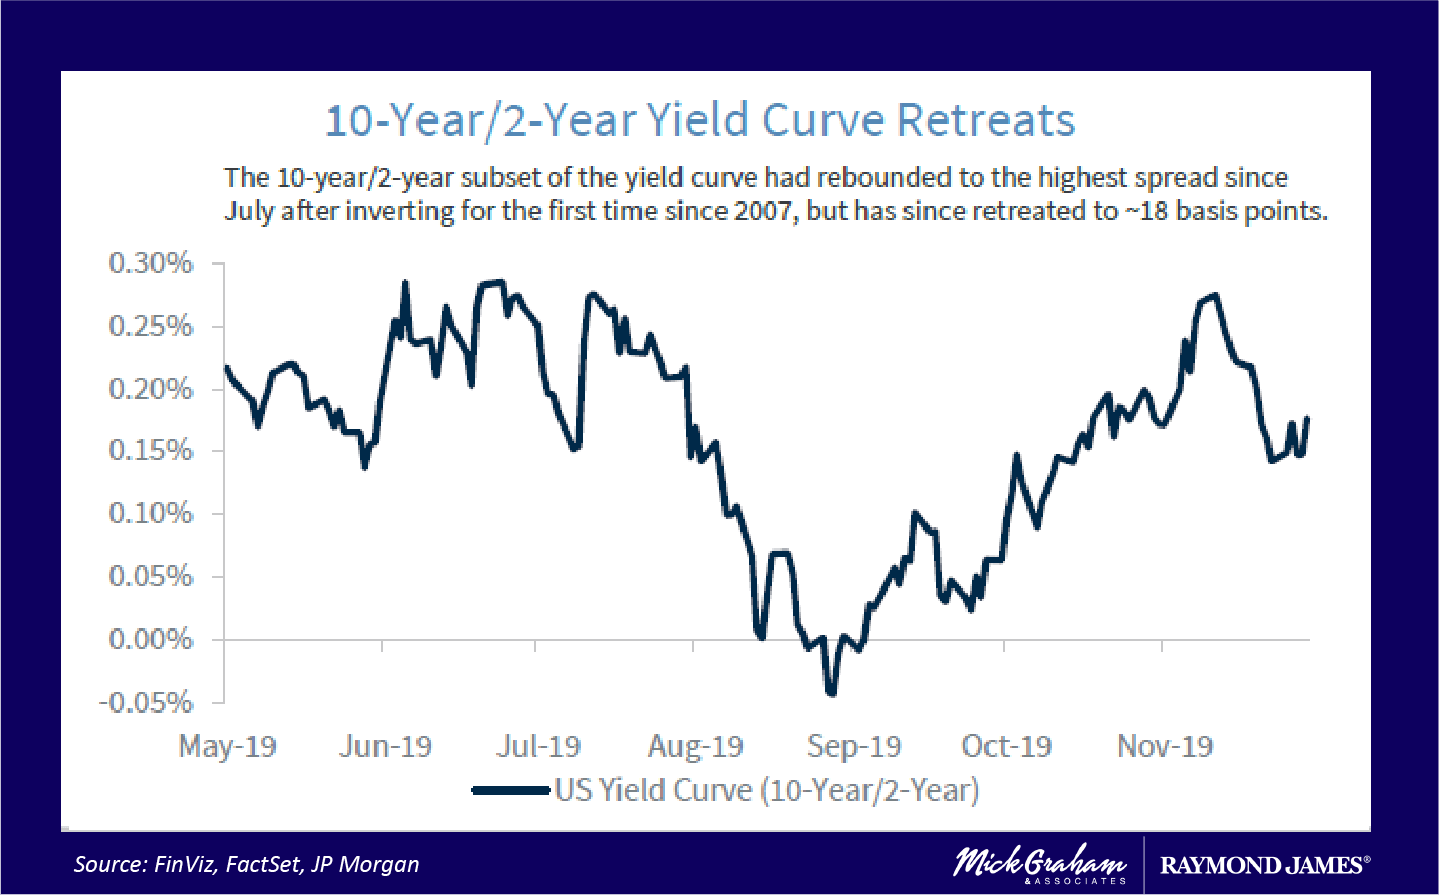
Recession Fears
Back in September the financial media had us all believing that the spread between the 10-year treasury and the 2-year treasury (which went negative) was the indicator that recession was imminent. That turned around quickly and the fed fixed its earlier mistakes by arbitrarily raising interest rates and dropped the Fed funds rate by 50 basis points over two meetings.
Now as you’ve seen in the past, anything can happen in the short term so there will be no champagne corks popped till the bell is rung on the last trading day of the year, however 2019 is setting itself up to be an all-star year.
“That’s great Mick, but what’s that mean for the future?? This is what I pay you for….Well that’s coming next week.” Here’s the buy/sell.
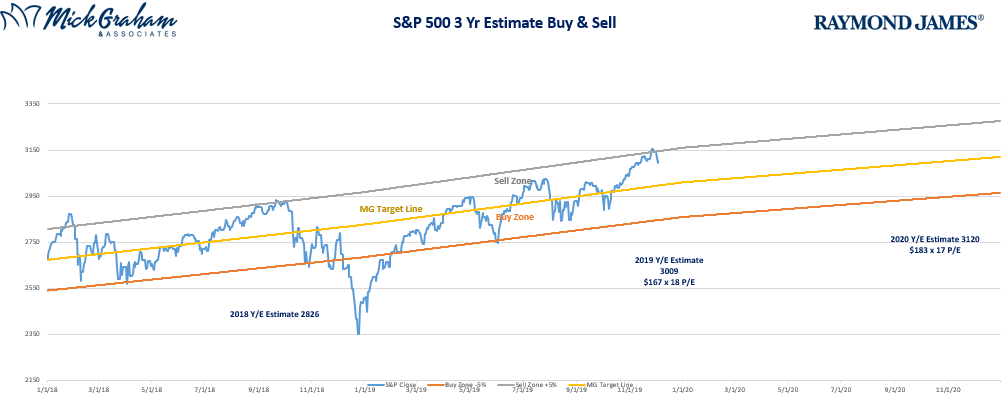
Source: MG&A
The information contained in this report does not purport to be a complete description of the securities, markets, or developments referred to in this material. The information has been obtained from sources considered to be reliable, but we do not guarantee that the foregoing material is accurate or complete. Any opinions are those of Mick Graham and not necessarily those of Raymond James. Expressions of opinion are as of this date and are subject to change without notice. There is no guarantee that these statements, opinions or forecasts provided herein will prove to be correct. Investing involves risk and you may incur a profit or loss regardless of strategy selected. Keep in mind that individuals cannot invest directly in any index, and index performance does not include transaction costs or other fees, which will affect actual investment performance. Individual investor's results will vary. Past performance does not guarantee future results. Future investment performance cannot be guaranteed, investment yields will fluctuate with market conditions.
The S&P 500 is an unmanaged index of 500 widely held stocks that is generally considered representative of the U.S. stock market.
The Bloomberg Barclays US Aggregate Bond Index is a broad-based flagship benchmark that measures the investment grade, US dollar-denominated, fixed-rate taxable bond market.
There is generally an inverse relationship between interest rate movements and bond prices.
Sector investments are companies engaged in business related to a specific sector. They are subject to fierce competition and their products and services may be subject to rapid obsolescence. There are additional risks associated with investing in an individual sector, including limited diversification.
