Mean Reversion

If I ever decide to start a band, it would be called Mean Reversion. I can totally see it written across the bass drum, while I’m playing guitar with my long hair swooshing up and down as I bang my head pumping out some old rock ‘n’ roll music.
Fortunately for you and that of your fellow listeners of good music, mean reversion is a financial term and not likely to be the name of a band, or at least not one that I’m a part of. It is however a long-standing investment principal that hits at the core of my decision-making process.
The basic description of mean reversion is a financial theory that suggests asset prices and historical returns will eventually return back to the long run average of the entire data set. It does extend beyond typical securities and can also be viewed on the economy as a whole, and also comparing different markets, sectors and industries.
The best example I can give you is the Buy/Sell Chart that I produce daily and send to you in the email each week. I simply draw a line between where the market was priced on the starting date and where I believe is the fair value of the market. That will produce a straight line. As you know the market does not move in a straight line, and nor do we want it to. At the core of capitalism is opportunity. Opportunity to start, opportunity to grow and opportunity to profit. The whole point of my graph highlights visually when I believe the market is cheap, and when it is expensive. What I am saying is when you get those days that fall into the “buy zone or sell zone” is that I’m arguing that there will be a reversion to the mean.
I can make both fundamental and technical arguments on why paying attention to variances from the mean, is a prudent strategy. It can highlight both warning signals and opportunities in a wide range of areas and markets, let’s just review some examples.
Economics
I review economics, a lot like a pilot will check the weather on their flight path. Can we expect a smooth ride? Or will we have to navigate around a few bumps? I’ve previously discussed the Leading Economic Indicators that I use to measure a tipping over of the economy, however there are several other data points that show both opportunities and warning signals.
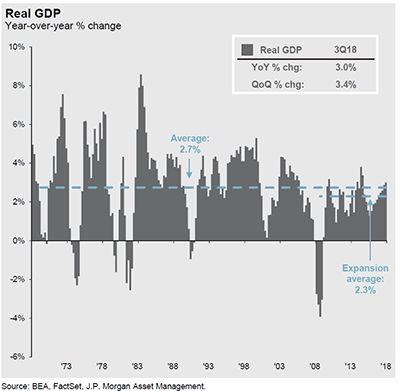
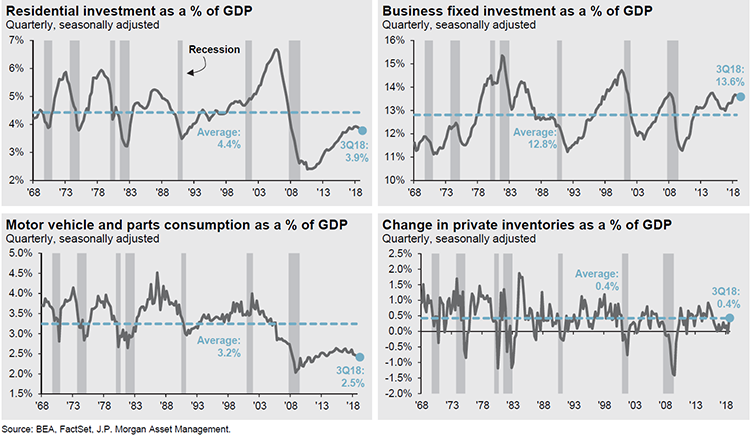
A review of GDP and consumption metrics can give you a guide on both where we are in an economic cycle and areas that are have room to grow.
Warning Signs
As you can see below, when unemployment numbers have been around 4% it signals a warning for the national unemployment rate to rise. The chart below dating back to the 70s has been a pretty consistent indicator.

Markets
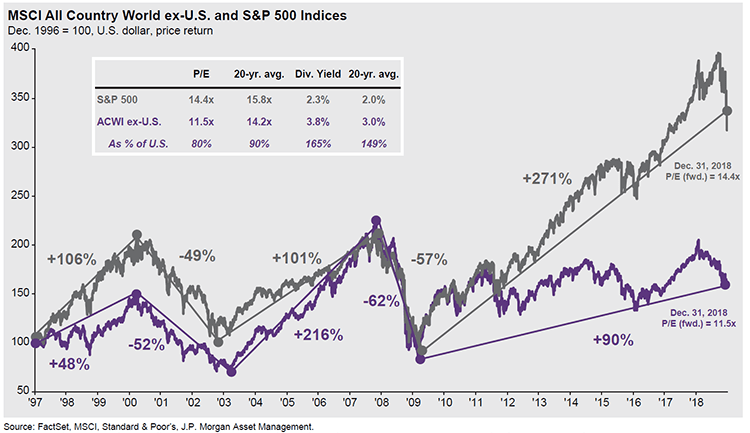
The P/E (Price to Earnings Ratio) has been a long-measured metric, originally highlighted by Robert Schiller. I am not a fan of measuring a P/E for an individual stock, however I do like to measure it on an index like the S&P 500 or an international index like the MSCI World Index. As you just witnessed first hand, the markets can go from what is classified as expensive to cheap very quickly. The start of 4th quarter of 2018 had the market priced at around 19 times, and a quick 19.78% decline had it at 14.4 by years end.
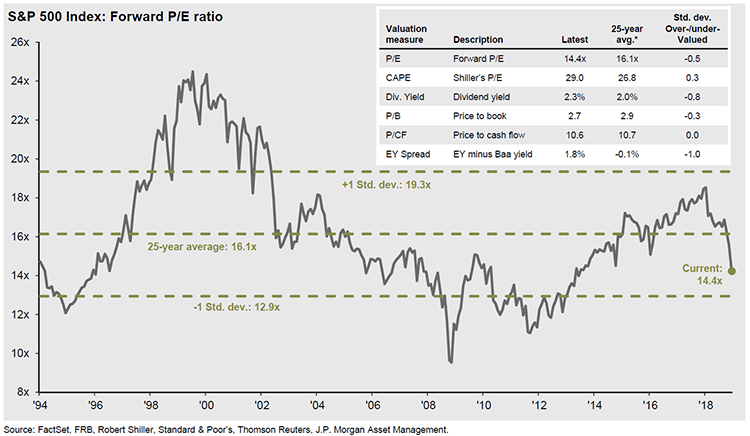
Source: JP Morgan
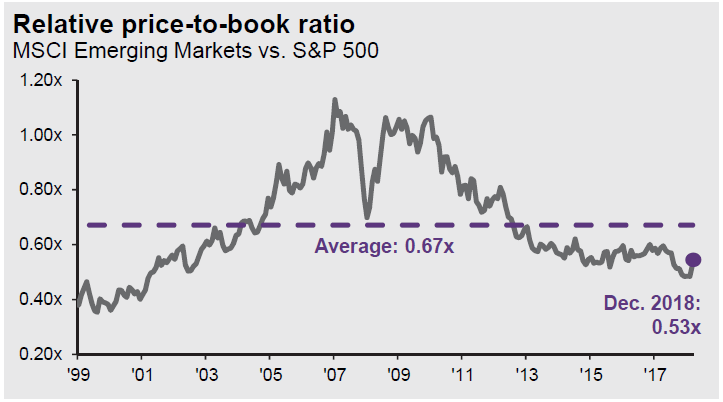
Again, I highlighted international markets a few weeks back, however I think the chart below is worth touching on. Mean reversion can be swift and violent (like the chart above) or can take a lot longer. Since the ‘08 financial crisis you can see the U.S. has outperformed the rest of the world, even though the majority of the toxic assets that caused the markets to re price were U.S. based. It has taken a lot longer for international banks (especially European Banks) to create stability and obtain economic growth.
Size & Style
Digging deeper into the equity markets, you can also argue that size and style can pinpoint opportunity vs. warning signs. Reversion to the mean is not always highlighted as a line graph.


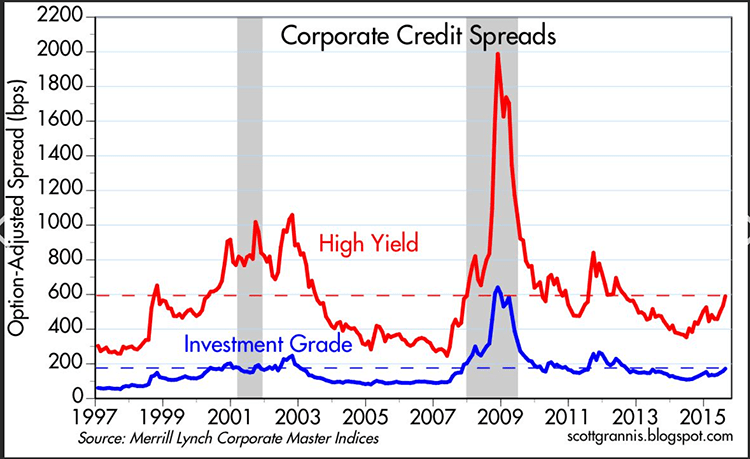
Fixed Income
The bond market is not exempt to mean reversion. The spread between high yield bonds and investment grade bonds is a measure I’ve used consistently. The lower the spread between the High Yield

Just like the seasons, business both in the U.S. and abroad will have times where the fertilizer and watering will aid growth, and other times when they will go dormant. As long as gravity still exists (things that go up must come down), mean reversion will ring bells and sound sirens. There are many more charts that I could have included in this article, other assets classes, sectors of the equity markets and even individual securities. I think too much info can just confuse the issue. It’s really just as simple as getting the good combination of rock and roll.
With that here is your Buy/Sell
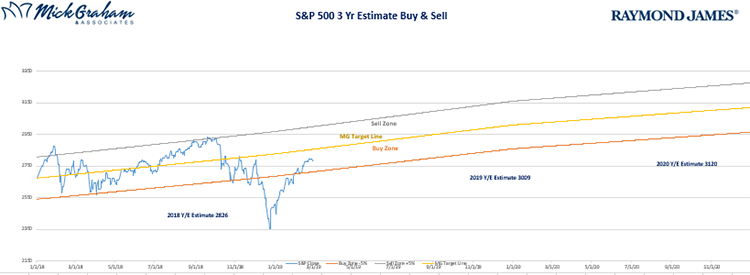
Source: MG&A
Any opinions are those of Mick Graham and not necessarily those of RJFS or Raymond James. The information contained in this report does not purport to be a complete description of the securities, markets, or developments referred to in this material. There is no assurance any of the trends mentioned will continue or forecasts will occur. The information has been obtained from sources considered to be reliable, but Raymond James does not guarantee that the foregoing material is accurate or complete. Any information is not a complete summary or statement of all available data necessary for making an investment decision and does not constitute a recommendation. Investing involves risk and you may incur a profit or loss regardless of strategy selected. Asset allocation and diversification do no guarantee against a loss. Leading Economic Indicators are selected economic statistics that have proven valuable as a group in estimating the direction and magnitude of economic change. Gross Domestic Product (GDP) is the annual market value of all goods and services produced domestically by the US. The price-to-earnings ratio (P/E ratio) is the ratio for valuing a company that measures it current share price relative to its per-share earnings. The MSCI World Index is a free float-adjusted market capitalization weighted index that is designed to measure the equity market performance of developed markets. As of June 2007 the MSCI World Index consisted of the following 23 developed market country indices: Australia, Austria, Belgium, Canada, Denmark, Finland, France, Germany, Greece, Hong Kong, Ireland, Italy, Japan, Netherlands, New Zealand, Norway, Portugal, Singapore, Spain, Sweden, Switzerland, the United Kingdom, and the United States. MSCI Emerging Markets Index is designed to measure equity market performance in 23 emerging market countries. The index's three largest industries are materials, energy, and banks. The S&P 500 is an unmanaged index of 500 widely held stocks that's generally considered representative of the U.S. stock market. Inclusion of these indexes is for illustrative purposes only. Keep in mind that individuals cannot invest directly in any index, and index performance does not include transaction costs or other fees, which will affect actual investment performance. Individual investor's results will vary. Past performance does not guarantee future results. Sector investments are companies engaged in business related to a specific sector. They are subject to fierce competition and their products and services may be subject to rapid obsolescence. There are additional risks associated with investing in an individual sector, including limited diversification. International investing involves special risks, including currency fluctuations, different financial accounting standards, and possible political and economic volatility. Investing in emerging markets can be riskier than investing in well-established foreign markets. Investing involves risk and investors may incur a profit or a loss. Bond prices and yields are subject to change based upon market conditions and availability. If bonds are sold prior to maturity, you may receive more or less than your initial investment. Holding bonds to term allows redemption at par value. There is an inverse relationship between interest rate movements and bond prices. Generally, when interest rates rise, bond prices fall and when interest rates fall, bond prices generally rise. Junk bond, or high-yield, is a bond that is rated below investment grade. These bonds have a higher risk of default or other adverse credit events, but typically pay higher yields than better quality bonds in order to make them attractive to investors. High-yield bonds are not suitable for all investors.
