Commodities
I tell new investors that there are six basic assets classes that I can invest into for them, namely Stocks, Bond, Cash, Currencies, Commodities and Real Estate. For those that are relatively new to the investing world I describe the difference between some of the asset classes this way: Stocks you are an owner, Bonds you are a loaner, and if you owned commodities since the financial crisis you are a Loner.
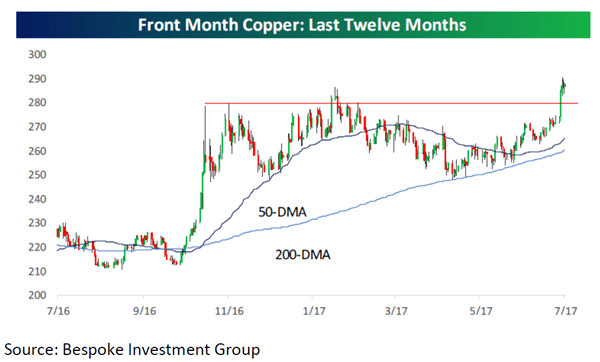
Tongue in cheek of course but the previously un-loved commodity sector has made some sharp moves in the past few months that have the biggest skeptics paying attention, yours truly included. Now I have a little more background in commodities than most would think, as a native Australian, a large part of our market and most of our economy was driven by resources, so commodity price indexes are shown as much as stock indexes are here. Resources such as coal and metals such as copper when bullish have always been instilled in me as signs of a strong economy to come. In fact, one of my previous mentors used copper prices as one of his main barometers of how much stock would be in his portfolio. He felt that they are a “leading indicator” for the overall stock markets.

It’s been argued for some time that when you have high copper demands the down cycle of that is a greater infrastructure spend which obviously helps all the other sectors. Copper prices are up some 30% over the past year and oil believe it or not has risen 24% according to FactSet.

For me a long bullish run on copper and other metals is a sign that we are in the second phase of a bull run (or what they call late cycle), when countries like my homeland as well as Canada, Brazil and Chile (all resource based economies) start to outpace other regions. Don’t worry if this is truly the case I feel it’s only early and this second phase still has a long way to run. Overall, I just want you to know that I have my eye on these assets and will be watching closely, as a good diversified portfolio has exposure to MANY the asset classes.

On the markets, we went through the 22,000 mark on the Dow Jones Industrial Average, and its normal to think when markets are hitting all-time highs that this makes the market expensive. I’ve written previously about my argument why I feel that’s not the case, however I found a chart I think shows this well:

The figure above by Bespoke Investment Group expresses how the S&P 500’s current 1-2-5-10 & 20-year returns compare to those same time periods dating back to 1929. For instance, the last 12 months returns (that most would consider very good) is only 58.7% of one-year periods looking back through time. The two year is below average. The 5 year is close to the top quintile, however what is surprising is that we have just come through one of the worst 20-year periods in history. Earnings have been strong as over half of the S&P 500 reporting Q2, and there is nothing that is making us review any of our year end forecast at this stage. The good news is that any risk to our numbers at this stage are to the upside.
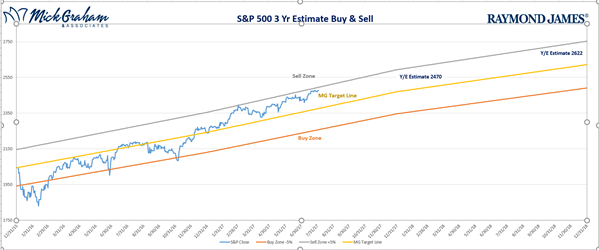
The buy sell for this week came off the line from the week before and still within our range:

Source: MG&A
Another fun week watching politics or (Poly Ticks) as I highlighted last week. A lot of staff turnover as the administration looks to get something in the agenda accomplished. With health care on the sidelines till after the August recess, tax reform has bubbled back to the surface.
Have a great week. As always should you have any questions, please don’t hesitate to contact us.
Regards

This information has been obtained from sources considered to be reliable, but Raymond James does not guarantee that the foregoing material is accurate or complete. Any opinions are those of Mick Graham and not necessarily those of RJFS or Raymond James. The information contained in this report does not purport to be a complete description of the securities, markets, or developments referred to in this material. Inclusion of these indexes is for illustrative purposes only. Keep in mind that individuals cannot invest directly in any index, and index performance does not include transaction costs or other fees, which will affect actual investment performance. Individual investor's results will vary. Past performance does not guarantee future results. The S&P 500 is an unmanaged index of 500 widely held stocks that is generally considered representative of the U.S. stock market. The Dow Jones Industrial Average (DJIA) is a price-weighted average of 30 significant stocks traded on the New York Stock Exchange (NYSE) and the NASDAQ. Commodities' investing is generally considered speculative because of the significant potential for investment loss. Their markets are likely to be volatile and there may be sharp price fluctuations even during periods when prices overall are rising.

