P/E Ratios Should Be Higher & Here’s Why
I’ve written this to clients a lot over the last few months as I consistently receive questions about the S&P 500 being at all-time highs. The average trailing 12 P/E on the S&P 500 for the last 25 years is around 16X. See graph below (from JP Morgan Funds) showing as of June 30 the S&P500 was 17.5.
I have the following argument(s) why P/Es should be higher and I would argue that they may even be cheap.
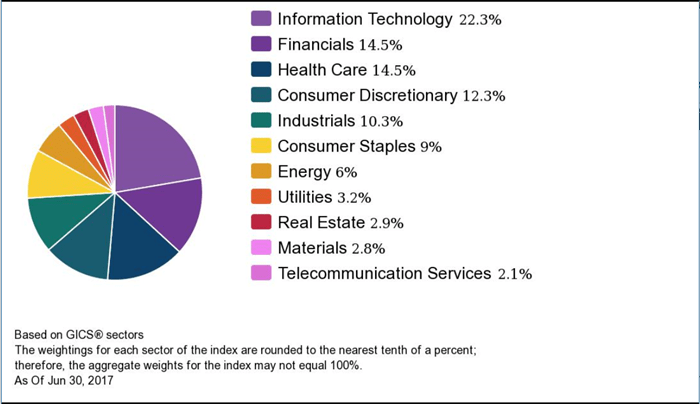
Today the S&P has a higher level of High Growth companies that the historical average.
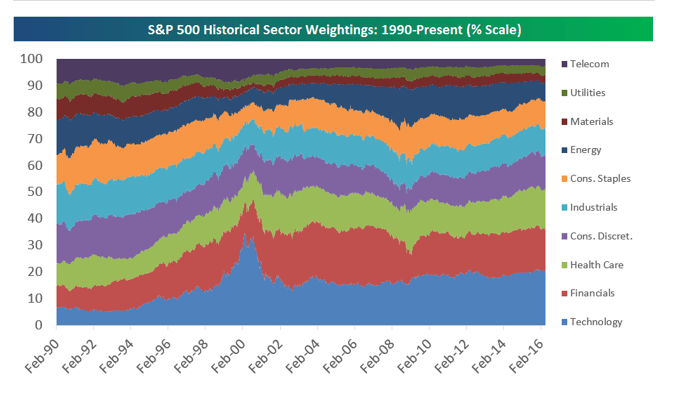
Tech companies which are historically high PE growth companies, now dominate a lot more of the index than 25 years ago. Yes I hear arguments that they held more in the tech crash, however the E or earnings component was missing. This has come at the cost telecom, industrials, energy and utilities, who have all been classified as lower P/E value companies.
Source: seekingalpha.com


Source: seekingalpha.com
Today tech companies take up 3 of the top 4 positions in the S&P 500 when ranked by market cap.
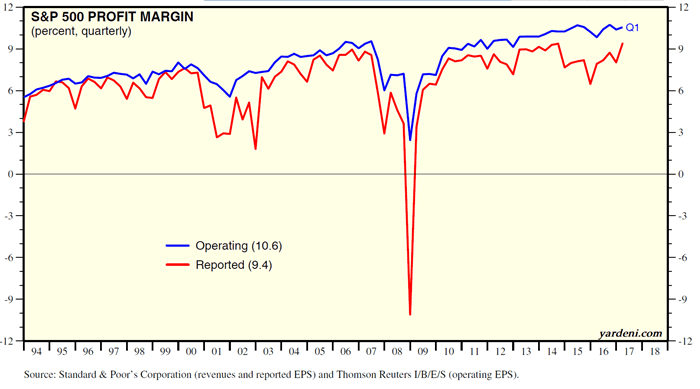
The S&P 500 has a higher level of companies with higher margins than previous.
Margins both gross and net have grown since the 90s, with an obvious exclusion for the last recession. To me this highlights a shift in the index itself. Higher earnings cost more to buy, especially in a low interest rate environment.
There is a major shift from tangible assets to intangible assets.
This is not as well publicized as the other two points, however a survey conducted by Ocean Tomo (the Intellectual Capital Merchant Banc) caught some attention recently when the report showed an inversion from the mid-70s when 83% of the index was made up of companies that tangible assets and today that figure has completely reversed.
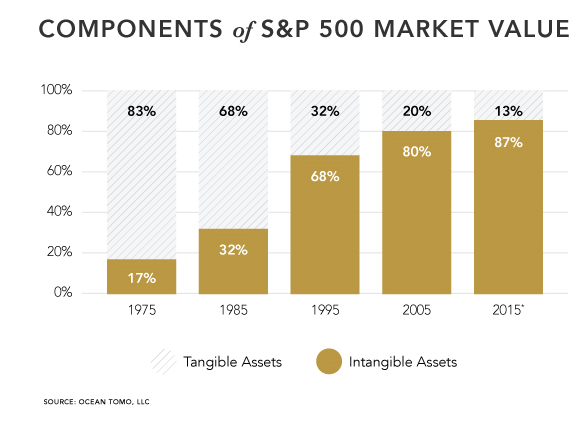
Now that said, I do not know how what methodology is used to produce this data, however what I take away is that there has been a shift in the past few decades and I for one don’t see that changing in the future.
![]()
All in all, I’m comfortable maintaining that we are in the midst of a long-sustained bull run that has more years to run. I always state that it all comes back to earnings, and obviously the price you pay for those earnings.
Should you have any questions or concerns, please don’t hesitate to give us a call.

The S&P 500 is an unmanaged index of 500 widely held stocks that’s generally considered representative of the U.S. stock market. Keep in mind that individuals cannot invest directly in any index. Past performance does not guarantee future results. The foregoing information has been obtained from sources considered to be reliable, but we do not guarantee that it is accurate or complete, it is not a statement of all available data necessary for making an investment decision, and it does not constitute a recommendation. Any opinions are those of Mick Graham and not necessarily those of Raymond James.
