

Many reasons to doubt the strength in employment
Chief Economist Eugenio J. Alemán discusses current economic conditions.
The U.S. labor market continues to be the star of the show, so to speak, for financial markets and for the U.S. economy, delivering an impressive number in September and defying expectations. We remain suspicious of the current strength as we were suspicious (and were shown to be correct after the recent revisions), of past strength. But not because we believe somebody is manipulating the data but because of what we have said for more than 2 years: that the disruptive effects of the pandemic are still reverberating across the economy and giving incorrect signs, in this case, of the U.S. labor market.
In order to gauge the U.S. labor market, we typically use a back of the envelope calculation which is nothing more than the average monthly growth in nonfarm payrolls dating back to the 1940’s. That average is close to 130,000 per month. It is not scientific; it is just an 85-year average. Thus, anything above that measure is judged to be strong and anything below is judged to be weak. The September number is on the very strong side. At the same time, other measures of economic activity are also pointing to a strong economic performance by the U.S. economy so this may not seem like an outlier.
But we also have our ears on the ground, and we hear clients and advisors with also no-so-scientific but highly credible stories of friends and family members having trouble landing a job, with many of those stories including recent university graduates. And we believe many of those stories because there have been clear signs that the labor market is not as strong as portrayed by some of the official statistics.
A recent research piece by the Federal Reserve Bank of Minneapolis titled “Fewer openings, harder to get hired: U.S. labor market likely softer than it appears” helps make sense of some of this data.1 The authors concluded that the “official job-vacancy data likely overstate tightness of labor market” and that “adjusting for long-term up-trend in vacancies shows U.S. Labor market has much more slack.” That is, they argue that what is happening today is not considered a structural shift as the above adjustment is consistent with the current business cycle.
The article adds that, “In the context of the Fed’s tighter monetary policy since 2022, open jobs have become less abundant, leading to a natural decline in job-finding. This development is the primary factor causing the unemployment rate to increase.” That is, it is possible to have an increase in the rate of unemployment that is void of a large increase in layoffs. When they measure the tightness of the U.S. labor market adjusting for the higher up-trend in vacancies, they find that “The unadjusted series suggests that right now each job seeker faces around 1.4 job openings. The adjusted series suggests the opposite: Each job faces 1.5 job seekers – much worse odds for unemployed workers.” Furthermore, economic research over the years has shown that “layoffs are historically the smaller factor” explaining the rate of unemployment and they find that this is what is occurring today in the U.S. labor market.
1: “Fewer openings, harder to get hired: U.S. labor market likely softer than it appears,” by Simon Mongey and Jeff Horwich, Federal Reserve of Minneapolis, September 5, 2024: https://www.minneapolisfed.org/article/2024/fewer- openings-harder-to-get-hired-us-labor-market-likely-softer-than-it-appears?utm_source=substack&utm_medium=email
According to the authors, “the job-finding rate typically explains more than 80 percent of changes in unemployment.” Thus, they conclude that even though there has been an increase in immigration since the end of the pandemic as well as tech sector layoffs, “the obvious explanation for the persistent rise in unemployment rate seems more likely to be the factor that affects everybody in the pool: a persistent decline in the demand for labor and, thus, the job-finding rate.” This is in line with what we are seeing and hearing from other sources of data, including what we hear in from the “grapevine” of our advisors and clients.
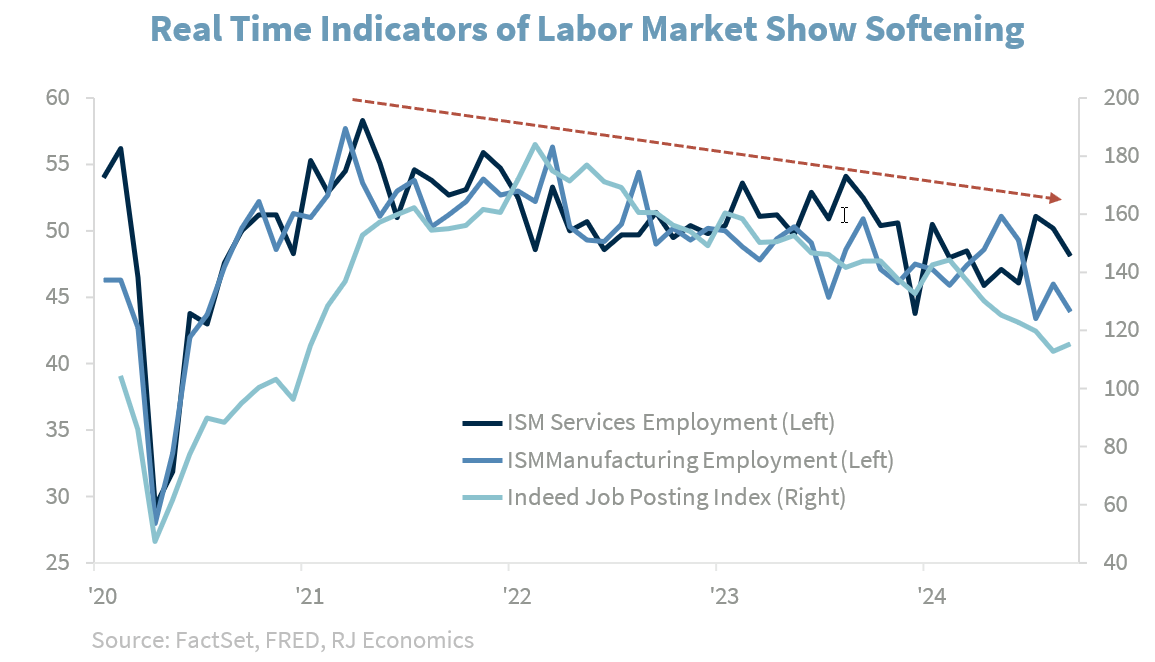
Some of these other timely data sources include the Institute of Supply Management surveys, where employment in both services and manufacturing industries has been softening since peaking in 2021; job postings on Indeed have been weakening to the lowest levels since 2021 (see chart below), etc. Additionally, the Automatic Data Processing (ADP) National Employment Report was much weaker this past month, while the JOLTS report showed the quits rate falling to the lowest level since 2020 and the Challenger Layoffs Index were over 50% year-over-year, just to mention some.
Thus, as many of these indicators show softening across the labor market, we expect the employment situation to continue to weaken as we move forward as we still expect economic activity to slow down from its current pace.
Extension to 2026 and changes to Q3 2024
We have extended our forecast until 2026 and revised our forecast for Q3 2024 to reflect recent stronger data. This kept the overall rate of growth unchanged at 2.6% for the year but pushed the rate of growth for 2025 slightly higher, from 2.0% to 2.1%.
Economic and market conditions are subject to change.
Opinions are those of Investment Strategy and not necessarily those of Raymond James and are subject to change without notice. The information has been obtained from sources considered to be reliable, but we do not guarantee that the foregoing material is accurate or complete. There is no assurance any of the trends mentioned will continue or forecasts will occur. Last performance may not be indicative of future results.
Consumer Price Index is a measure of inflation compiled by the US Bureau of Labor Statistics. Currencies investing is generally considered speculative because of the significant potential for investment loss. Their markets are likely to be volatile and there may be sharp price fluctuations even during periods when prices overall are rising.
Consumer Sentiment is a consumer confidence index published monthly by the University of Michigan. The index is normalized to have a value of 100 in the first quarter of 1966. Each month at least 500 telephone interviews are conducted of a contiguous United States sample.
Personal Consumption Expenditures Price Index (PCE): The PCE is a measure of the prices that people living in the United States, or those buying on their behalf, pay for goods and services. The change in the PCE price index is known for capturing inflation (or deflation) across a wide range of consumer expenses and reflecting changes in consumer behavior.
The Consumer Confidence Index (CCI) is a survey, administered by The Conference Board, that measures how optimistic or pessimistic consumers are regarding their expected financial situation. Current Situation Index (CSI) and Future Expectations Index (FEI) are the end-results of CCI, covering economic conditions, employment, price, income, and expense. The reading is 100 plus the average of said five factors
Certified Financial Planner Board of Standards Inc. owns the certification marks CFP®, CERTIFIED FINANCIAL PLANNER®, CFP® (with plaque design) and CFP® (with flame design) in the U.S., which it awards to individuals who successfully complete CFP Board's initial and ongoing certification requirements.
Links are being provided for information purposes only. Raymond James is not affiliated with and does not endorse, authorize or sponsor any of the listed websites or their respective sponsors. Raymond James is not responsible for the content of any website or the collection or use of information regarding any website's users and/or members.
GDP Price Index: A measure of inflation in the prices of goods and services produced in the United States. The gross domestic product price index includes the prices of U.S. goods and services exported to other countries. The prices that Americans pay for imports aren't part of this index.
The Conference Board Leading Economic Index: Intended to forecast future economic activity, it is calculated from the values of ten key variables.
The U.S. Dollar Index is an index of the value of the United States dollar relative to a basket of foreign currencies, often referred to as a basket of U.S. trade partners' currencies. The Index goes up when the U.S. dollar gains "strength" when compared to other currencies.
The FHFA House Price Index (FHFA HPI®) is a comprehensive collection of public, freely available house price indexes that measure changes in single-family home values based on data from all 50 states and over 400 American cities that extend back to the mid-1970s.
The Pending Home Sales Index (PHSI) tracks home sales in which a contract has been signed but the sale has not yet closed.
Supplier Deliveries Index: The suppliers' delivery times index from IHS Markit's PMI business surveys captures the extent of supply chain delays in an economy, which in turn acts as a useful barometer of capacity constraints.
Backlog of Orders Index: The Backlog of Orders Index represents the share of orders that businesses have received but have yet to start or finish. An increasing index value usually indicates growth in business but shows that output is below its maximum potential.
Import Price Index: The import price index measure price changes in goods or services purchased from abroad by
U.S. residents (imports) and sold to foreign buyers (exports). The indexes are updated once a month by the Bureau of Labor Statistics (BLS) International Price Program (IPP).
ISM Services PMI Index: The Institute of Supply Management (ISM) Non-Manufacturing Purchasing Managers' Index (PMI) (also known as the ISM Services PMI) report on Business, a composite index is calculated as an indicator of the overall economic condition for the non-manufacturing sector.
Consumer Price Index (CPI) A consumer price index is a price index, the price of a weighted average market basket of consumer goods and services purchased by households.
Producer Price Index: A producer price index (PPI) is a price index that measures the average changes in prices received by domestic producers for their output.
Industrial production: Industrial production is a measure of output of the industrial sector of the economy. The industrial sector includes manufacturing, mining, and utilities. Although these sectors contribute only a small portion of gross domestic product, they are highly sensitive to interest rates and consumer demand.
The NAHB/Wells Fargo Housing Opportunity Index (HOI) for a given area is defined as the share of homes sold in that area that would have been affordable to a family earning the local median income, based on standard mortgage underwriting criteria.
Conference Board Coincident Economic Index: The Composite Index of Coincident Indicators is an index published by the Conference Board that provides a broad-based measurement of current economic conditions, helping economists, investors, and public policymakers to determine which phase of the business cycle the economy is currently experiencing.
Conference Board Lagging Economic Index: The Composite Index of Lagging Indicators is an index published monthly by the Conference Board, used to confirm and assess the direction of the economy's movements over recent months.
New Export Index: The PMI new export orders index allows us to track international demand for a country's goods and services on a timely, monthly, basis.
Durable Goods: Durable goods orders reflect new orders placed with domestic manufacturers for delivery of long- lasting manufactured goods (durable goods) in the near term or future.
Source: FactSet, data as of 9/20/2024
