Allocation check-in
Strong equity market performance this year has provided a welcome boost to the total market value of many investment portfolios. As we approach the start of a new year, it is a good time to take a fresh look at your portfolio to ensure that it still aligns with your long-term goals. Many things can cause a well-aligned portfolio to fall out of alignment, such as a shift in risk tolerance, a change in financial goals, a life-status change, and the focus of today’s commentary: market performance. Even if nothing has changed with your personal financial situation, goals, or risk tolerance, market performance can dictate the necessity to rebalance a portfolio. Uneven performance between asset classes can cause a portfolio to move out of alignment from target allocations (known as drift). Regularly rebalancing your portfolio to re-align with target allocations can help to ensure that your portfolio performs as intended within appropriate risk levels.
At a high level, many portfolios are diversified between growth assets (primarily equities for many investors) and assets targeted to preserve wealth (typically invested in fixed income). The S&P 500 Total Return Index is up over 29% year-to-date while the US Aggregate Total Return Index (a broad market measure of bond market returns) is up by under 3%. The strong outperformance of equities this year relative to the bond market means that many investors are likely over-allocated to the growth/riskier portion of their portfolio. While being over-invested in equities might feel good when markets are going up, it can expose investors to undue risk and a more painful experience if/when there is an equity market pullback.
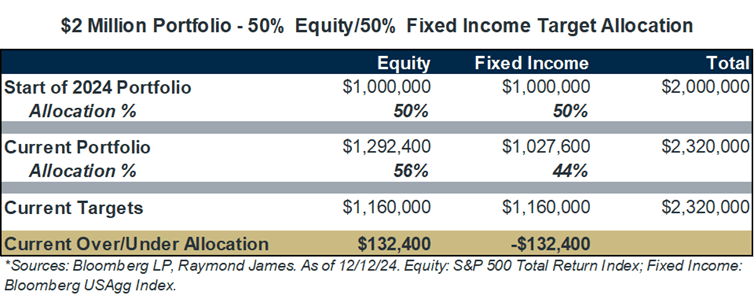
A hypothetical example may provide some context. The below chart illustrates an investor who had a $2 million portfolio with a 50/50 allocation at the beginning of the year. Given the year-to-date performance of each asset class (equities: +29.24%, fixed income: +2.76%) the current portfolio would be out of alignment from the target 50/50 allocation. As shown at the bottom of the chart, this portfolio could sell $132,400 of their equities and reinvest it into fixed income which would realign it to the desired target allocation/risk level going forward.

Click here to enlarge
Source: Bloomberg LP
Your portfolio allocation was put in place for a reason. Regardless of your specific breakdown (70/30, 60/40, 50/50, etc.), there is a high likelihood that the strong equity performance this year has pushed your portfolio out of balance. Don’t get complacent with the near 30% equity market return. While it is nice to see that level of growth in your portfolio, the growth has likely increased your overall risk exposure. Rebalancing some of the gains from equities into fixed income will lock in some of the market gains and redistribute them into the asset class that is well-suited to preserve the wealth that has been created: fixed income. There was likely considerable thought and analysis put into determining an appropriate asset allocation that aligns with your risk tolerance and long-term financial plan. Ensure that you stay on track by taking a fresh look at your portfolio and rebalancing, if necessary.
The author of this material is a Trader in the Fixed Income Department of Raymond James & Associates (RJA), and is not an Analyst. Any opinions expressed may differ from opinions expressed by other departments of RJA, including our Equity Research Department, and are subject to change without notice. The data and information contained herein was obtained from sources considered to be reliable, but RJA does not guarantee its accuracy and/or completeness. Neither the information nor any opinions expressed constitute a solicitation for the purchase or sale of any security referred to herein. This material may include analysis of sectors, securities and/or derivatives that RJA may have positions, long or short, held proprietarily. RJA or its affiliates may execute transactions which may not be consistent with the report’s conclusions. RJA may also have performed investment banking services for the issuers of such securities. Investors should discuss the risks inherent in bonds with their Raymond James Financial Advisor. Risks include, but are not limited to, changes in interest rates, liquidity, credit quality, volatility, and duration. Past performance is no assurance of future results.
Investment products are: not deposits, not FDIC/NCUA insured, not insured by any government agency, not bank guaranteed, subject to risk and may lose value.
To learn more about the risks and rewards of investing in fixed income, access the Financial Industry Regulatory Authority’s website at finra.org/investors/learn-to-invest/types-investments/bonds and the Municipal Securities Rulemaking Board’s (MSRB) Electronic Municipal Market Access System (EMMA) at emma.msrb.org.

