
Not all wealth is created equal
- 06.21.24
- Economy & Policy
- Commentary
Chief Economist Eugenio J. Alemán discusses current economic conditions.
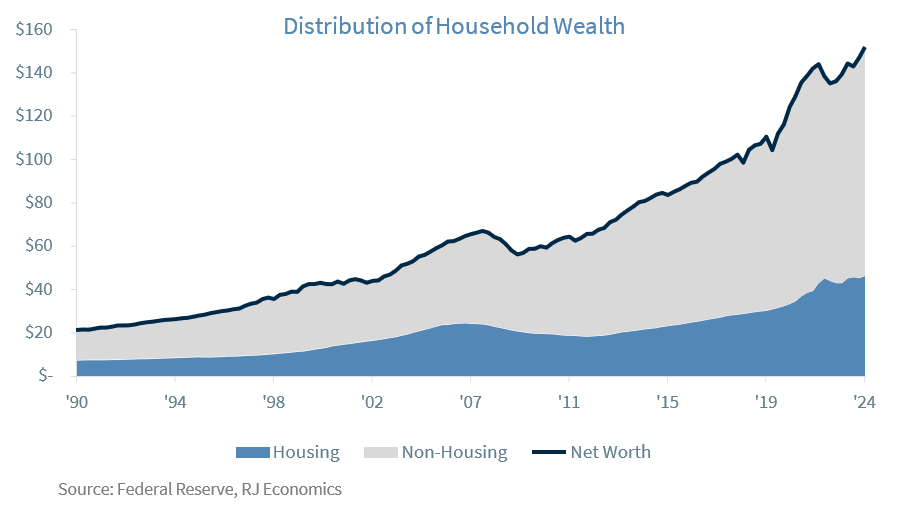
Total net worth, or household wealth, has reached a new record high, at least in nominal terms. This has pushed many to argue that Americans have been using the accumulation in net worth to increase consumption. And there is some truth around this idea that Americans have been using increases in wealth to increase consumption.
However, many economists, including us, have conducted research on this topic in the past and, while it is true that households use wealth accumulation to increase consumption, the impact of wealth accumulation on overall consumption is not as strong as many seem to suggest.1
But before getting into a deeper understanding of what is at stake with wealth we need to touch on some concepts that are second nature for economists but not so much for the general public. Households increase consumption out of what they earn in income. That is, households generate income from work and use this income to buy goods and services. Economists have defined the relationship between income and consumption as the marginal propensity to consume out of income (MPCI). This MPCI has been estimated at close to 96%-98% at the aggregate level. That is, out of each extra dollar of income we earn we spend close to 96 to 98 cents of that extra dollar of income. Of course, this is the aggregate MPCI, as this measure varies across different income levels. In general, the lower the income of a household, the higher is the MPCI and vice versa.
The marginal propensity to consume out of wealth, MPCW, is somewhat similar from the MPCI concept. That is, the MPCW measures how much of an extra dollar in wealth is used for consumption. The different studies measuring MPCW show that consumption out of each extra dollar of wealth is much smaller than the MPC out of income, MPCI. Estimates put the MPCW close to five cents per extra dollar of wealth. That is, for each extra dollar in wealth, households only consume about five cents of that dollar of extra wealth. This means that consumption goes up, but the overall impact is more muted than when individuals earn income, which is spent almost entirely.
But if we split wealth into housing wealth and non-housing or financial wealth, the story is a bit different. Studies show that the MPCW out of housing wealth is higher than the MPCW out of financial or non-housing wealth. According to estimates, households spend about two cents for each extra dollar earned in financial or non-housing wealth compared to about seven or eight cents out of each extra dollar earned from housing wealth. The reason for this is straight forward: housing wealth is more homogenously held by the population compared to financial wealth. This is because financial wealth tends to be held by those in the higher income segments of the population.
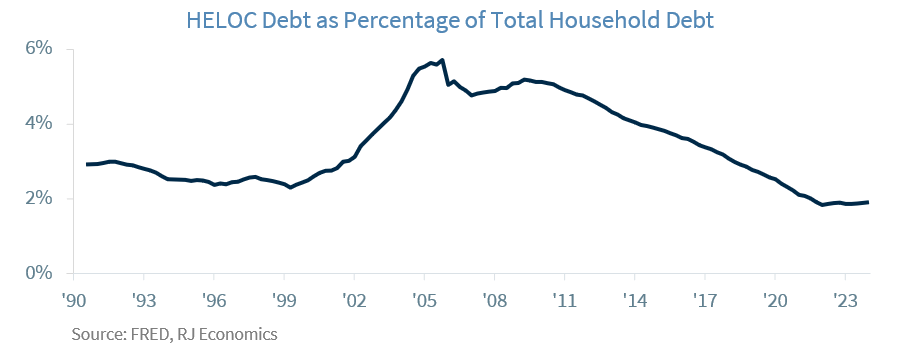
Furthermore, the amount of money that households can get out of increases in housing wealth depends on whether households have access to credit. That is, when credit is plentiful and easily available, i.e., low interest rates, households tend to be more willing to borrow and spend out of housing wealth. At the same time, when interest rates are lower and credit is more accessible, financial institutions are more willing to increase lending, as we saw during the period before the Great Recession. But today’s credit environment, i.e., high interest rates, is not conducive to higher household borrowing to access housing wealth and increase consumption from housing wealth. As the graph below shows, HELOC debt as a % of total debt has remained very low during this cycle compared to what happened before the Great Recession.
Although the recent increase in home prices as well as in stock valuations means that Americans have more resources to complement their incomes, there is no evidence that households are digging into their home equity to help them increase consumption. This means that probably the only ones benefiting from higher wealth today in terms of consumption are those in the higher income levels, which have seen a large increase in stock prices. However, those higher income households tend to increase consumption the least out of each extra dollar of wealth.
Economic and market conditions are subject to change.
Opinions are those of Investment Strategy and not necessarily those of Raymond James and are subject to change without notice. The information has been obtained from sources considered to be reliable, but we do not guarantee that the foregoing material is accurate or complete. There is no assurance any of the trends mentioned will continue or forecasts will occur. Last performance may not be indicative of future results.
Consumer Price Index is a measure of inflation compiled by the US Bureau of Labor Statistics. Currencies investing is generally considered speculative because of the significant potential for investment loss. Their markets are likely to be volatile and there may be sharp price fluctuations even during periods when prices overall are rising.
Consumer Sentiment is a consumer confidence index published monthly by the University of Michigan. The index is normalized to have a value of 100 in the first quarter of 1966. Each month at least 500 telephone interviews are conducted of a contiguous United States sample.
Personal Consumption Expenditures Price Index (PCE): The PCE is a measure of the prices that people living in the United States, or those buying on their behalf, pay for goods and services. The change in the PCE price index is known for capturing inflation (or deflation) across a wide range of consumer expenses and reflecting changes in consumer behavior.
The Consumer Confidence Index (CCI) is a survey, administered by The Conference Board, that measures how optimistic or pessimistic consumers are regarding their expected financial situation. A value above 100 signals a boost in the consumers’ confidence towards the future economic situation, as a consequence of which they are less prone to save, and more inclined to consume. The opposite applies to values under 100.
Certified Financial Planner Board of Standards Inc. owns the certification marks CFP®, CERTIFIED FINANCIAL PLANNER™, CFP® (with plaque design) and CFP® (with flame design) in the U.S., which it awards to individuals who successfully complete CFP Board's initial and ongoing certification requirements.
Links are being provided for information purposes only. Raymond James is not affiliated with and does not endorse, authorize or sponsor any of the listed websites or their respective sponsors. Raymond James is not responsible for the content of any website or the collection or use of information regarding any website's users and/or members.
GDP Price Index: A measure of inflation in the prices of goods and services produced in the United States. The gross domestic product price index includes the prices of U.S. goods and services exported to other countries. The prices that Americans pay for imports aren't part of this index.
The Conference Board Leading Economic Index: Intended to forecast future economic activity, it is calculated from the values of ten key variables.
The Conference Board Coincident Economic Index: An index published by the Conference Board that provides a broad-based measurement of current economic conditions.
The Conference Board lagging Economic Index: an index published monthly by the Conference Board, used to confirm and assess the direction of the economy's movements over recent months.
The U.S. Dollar Index is an index of the value of the United States dollar relative to a basket of foreign currencies, often referred to as a basket of U.S. trade partners' currencies. The Index goes up when the U.S. dollar gains "strength" when compared to other currencies.
The FHFA House Price Index (FHFA HPI®) is a comprehensive collection of public, freely available house price indexes that measure changes in single-family home values based on data from all 50 states and over 400 American cities that extend back to the mid-1970s.
Import Price Index: The import price index measure price changes in goods or services purchased from abroad by U.S. residents (imports) and sold to foreign buyers (exports). The indexes are updated once a month by the Bureau of Labor Statistics (BLS) International Price Program (IPP).
ISM New Orders Index: ISM New Order Index shows the number of new orders from customers of manufacturing firms reported by survey respondents compared to the previous month. ISM Employment Index: The ISM Manufacturing Employment Index is a component of the Manufacturing Purchasing Managers Index and reflects employment changes from industrial companies.
ISM Inventories Index: The ISM manufacturing index is a composite index that gives equal weighting to new orders, production, employment, supplier deliveries, and inventories.
ISM Production Index: The ISM manufacturing index or PMI measures the change in production levels across the U.S. economy from month to month.
ISM Services PMI Index: The Institute of Supply Management (ISM) Non-Manufacturing Purchasing Managers' Index (PMI) (also known as the ISM Services PMI) report on Business, a composite index is calculated as an indicator of the overall economic condition for the non-manufacturing sector.
Consumer Price Index (CPI) A consumer price index is a price index, the price of a weighted average market basket of consumer goods and services purchased by households. Changes in measured CPI track changes in prices over time.
Producer Price Index: A producer price index (PPI) is a price index that measures the average changes in prices received by domestic producers for their output.
Industrial production: Industrial production is a measure of output of the industrial sector of the economy. The industrial sector includes manufacturing, mining, and utilities. Although these sectors contribute only a small portion of gross domestic product, they are highly sensitive to interest rates and consumer demand.
The NAHB/Wells Fargo Housing Opportunity Index (HOI) for a given area is defined as the share of homes sold in that area that would have been affordable to a family earning the local median income, based on standard mortgage underwriting criteria.
The S&P CoreLogic Case-Shiller U.S. National Home Price NSA Index measures the change in the value of the U.S. residential housing market by tracking the purchase prices of single-family homes.
The S&P CoreLogic Case-Shiller 20-City Composite Home Price NSA Index seeks to measures the value of residential real estate in 20 major U.S. metropolitan.
Source: FactSet, data as of 7/7/2023
