
So Far, So Good
The first quarter of 2024 took a lot of strategists by surprise. Many doubled down on their unrequited recession forecasts for 2023, only to be left at the altar once again. The business of forecasting is turning into an extended version of “Waiting for Godot” (or is it Guffman?).
Why do they keep getting it wrong? In the opinion of this observer, it’s because this cycle is just different from the typical business cycle due to the pandemic and the government response to it. Unprecedented amounts of stimulus were placed in the hands of consumers during the pandemic and then the government followed that up with massive investments in semiconductors, onshoring and clean energy, all on borrowed money. We are levered up, and we’ve got the debt and deficits to prove it.
Let’s look at the numbers, courtesy of JP Morgan Asset Management as of April 15, 2024:
Weekly Data Center
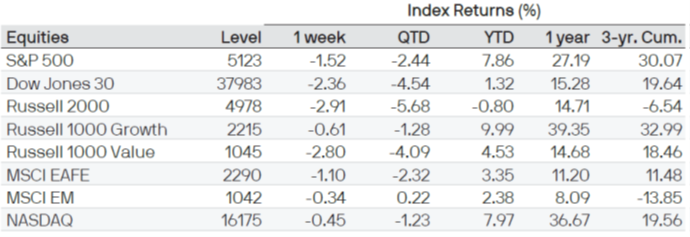
There’s no debating the numbers, the numbers are good. The question is, are they coming only at the expense of debt and deficits? And what about the geopolitical situation?
Add it all up and I’d say we’re due for a pause. It’s not WW III, it’s not the end of the world, I believe it’s just a pause at the end of a very good run.
Any opinions are those of the author and not necessarily those of Raymond James. The foregoing information has been obtained from sources considered to be reliable, but we do not guarantee that it is accurate or complete, it is not a statement of all available data necessary for making an investment decision, and it does not constitute a recommendation. All opinions are as of this date and are subject to change without notice. Investing involves risk and you may incur a profit or loss regardless of strategy selected, including asset allocation and diversification. Past performance is not a guarantee of future results.
The S&P 500 is an unmanaged index of 500 widely held stocks that is generally considered representative of the U.S. stock market. The Dow Jones Industrial Average (DJIA), commonly known as “The Dow” is an index representing 30 stock of companies maintained and reviewed by the editors of the Wall Street Journal. The NASDAQ composite is an unmanaged index of securities traded on the NASDAQ system.
The Russell 2000 Index measures the performance of the 2,000 smallest companies in the Russell 3000 Index, which represent approximately 8% of the total market capitalization of the Russell 3000 Index.
The Russell 1000 Value Index measures the performance of those Russell 1000 companies with higher price-to-book ratios and lower forecasted growth values. The Russell 1000 Growth Index measures the performance of those Russell 1000 companies with higher price-to-book ratios and higher forecasted growth values.
The MSCI EAFE (Europe, Australasia, and Far East) is a free float-adjusted market capitalization index that is designed to measure developed market equity performance, excluding the United States & Canada. The EAFE consists of the country indices of 22 developed nations. The MSCI Emerging Markets is designed to measure equity market performance in 25 emerging market indices. The index's three largest industries are materials, energy, and banks.
Keep in mind that individuals cannot invest directly in any index, and index performance does not include transaction costs or other fees, which will affect actual investment performance. Individual investor's results will vary.
