
The Week in Review 3/3/25
“I am a tariff man, standing on a tariff platform.” – William McKinley
Good Morning,
We close out February, a seasonally sloppy month, with volatility.
The Nasdaq Composite slumped 3.5%, turning negative for the year, and the S&P 500 logged a 1.0% decline.
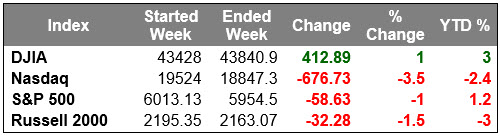
The Dow Jones Industrial Average ultimately registered a 1.0% gain this week after some recovery on Friday. The Dow was also negative heading into Friday.
Increased selling in the mega cap space led to the disproportionate price action in the Nasdaq Composite, versus other major indices. NVIDIA was a big drag in that respect after decent earnings failed to live up to lofty expectations. Shares dropped 7.1% last week.
Buy-the-dip strategies, which proved quite successful earlier in the month, stalled out last week. This fueled the unwinding of momentum trades, which was another contributing factor driving the selling in NVDA. The initial trigger for the negative bias was inflation worries, growth concerns rooted in tariff proposals, and efforts to cut government spending… along with some soft economic data.
Last week’s data included the February Consumer Confidence Index, which featured a drop in the index from 105.3 to 98.3 (the largest monthly decline since August 2021) and a surge in average 12-month inflation expectations from 5.2% to 6.0%.
New home sales declined 10.5% month-over-month in January to a seasonally adjusted annual rate of 657,000, there was a jump in weekly initial jobless claims and the pending home sales index hit a record low in January. Weather could have been a contributor to the weak numbers.
Also, the Personal Income and Spending report for January showed welcome disinflation on a year-over-year basis in the core-PCE Price Index (the Fed's preferred inflation measure), yet there was a noticeable 0.5% month-over-month decline in real personal spending, which could be a drag on Q1 GDP forecasts.
As a result, the Atlanta Fed GDPNow forecast for Q1 GDP was revised to a 1.5% contraction from 2.3% growth in the last estimate.
On the tariff front, President Trump announced that tariffs for Canada and Mexico will start March 4; and that an additional 10% tariff for China will go into effect the same day. That followed an indication that a 25% tariff for the EU will be announced soon.
There was also new developments on the geopolitical front that market participants were responding to.
President Trump and Ukraine's President Zelenskyy had a heated meeting in the White House, leading Mr. Trump to tell Mr. Zelenskyy he is "gambling with World War III." Market participants were hopeful President Zelenskyy would sign a rare earths deal when he visited the White House, but that did not materialize.
Treasuries settled sharply higher in response to the growth concerns and tariff worries.
The 10-yr yield sank 19 basis points last week, and 34 basis points in February, to 4.23%. The 2-yr yield settled 19 basis points lower this week, and 24 basis points lower this month, to 4.00%.
Crude oil fell back below $70/bbl, widening its February loss to $2.75, or 3.8%, in another manifestation of growth concerns that could impact demand.
It’s clear we have some headwinds…
Economic growth concerns have led to increased equity market volatility, as the S&P 500 is now negative YTD.
- While personal income increased 0.9% in January, spending posted the largest monthly decline in three years.
- 10-year Treasury yields are on track for the fifth consecutive week of declines—the longest streak since July 2021.
- Trump confirmed the 25% tariffs on Canada/Mexico on March 4 and announced an additional 10% tariff on China.
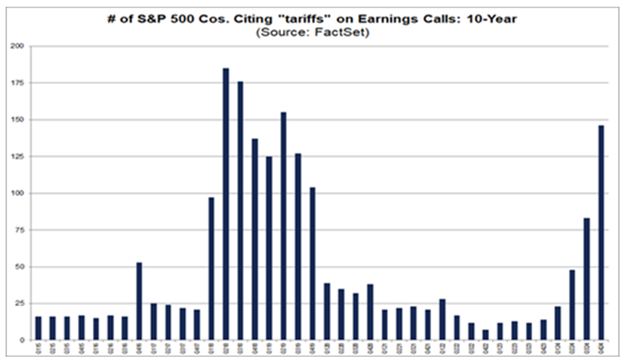
Inflation expectations are creeping back into the tariff narrative.
The week ahead…
Have a wonderful week!
Michael D. Hilger, CEP®
Managing Director
The opinions expressed herein are those of Michael Hilger and not necessarily those of Raymond James & Associates, Inc., and are subject to change without notice. The information contained in this report does not purport to be a complete description of the securities, markets, or developments referred to in this material. There is no assurance any of the trends mentioned will continue or forecasts will occur. The information has been obtained from sources considered to be reliable, but Raymond James does not guarantee that the foregoing material is accurate or complete. Investing involves risk and you may incur a profit or loss regardless of strategy selected.
The information contained herein is general in nature and does not constitute legal or tax advice. Inclusion of these indexes is for illustrative purposes only. Keep in mind that individuals cannot invest directly in any index, and index performance does not include transaction costs or other fees, which will affect actual investment performance. Individual investor's results will vary. Past performance does not guarantee future results. The Dow Jones Industrial Average (INDU) is the most widely used indicator of the overall condition of the stock market, a price-weighted average of 30 actively traded blue chip stocks, primarily industrials. The Dow Jones Transportation Average (DJTA, also called the "Dow Jones Transports") is a U.S. stock market index from the Dow Jones Indices of the transportation sector, and is the most widely recognized gauge of the American transportation sector. Standard & Poor's 500 (SPX) is a basket of 500 stocks that are considered to be widely held. The S&P 500 index is weighted by market value, and its performance is thought to be representative of the stock market as a whole. The S&P 500 is an unmanaged index of widely held stocks that is generally representative of the U.S. stock market. Keep in mind that individuals cannot invest directly in any index, and index performance does not include transaction costs and other fees, which will affect investment performance. Individual investor’s results will vary. The NASDAQ Composite Index (COMP.Q) is an index that indicates price movements of securities in the over-the-counter market. It includes all domestic common stocks in the NASDAQ System (approximately 5,000 stocks) and is weighted according to the market value of each listed issue. The NASDAQ-100 (^NDX) is a modified capitalization-weighted index. It is based on exchange, and it is not an index of U.S.-based companies. The Russell 2000 index is an unmanaged index of small cap securities which generally involve greater risks.
U.S. government bonds and Treasury notes are guaranteed by the U.S. government and, if held to maturity, offer a fixed rate of return, and guaranteed principal value. U.S. government bonds are issued and guaranteed as to the timely payment of principal and interest by the federal government. Treasury notes are certificates reflecting intermediate-term (2 - 10 years) obligations of the U.S. government.
The companies engaged in business related to a specific sector are subject to fierce competition and their products and services may be subject to rapit obsolescence. There are additional risks associated with investing in an individual sector, including limited diversification.
Dividends are not guaranteed and must be authorized by the company's board of directors.
Diversification does not ensure a profit or guarantee against a loss.
Investing in oil involves special risks, including the potential adverse effects of state and federal regulation and may not be suitable for all investors.
International investing involves special risks, including currency fluctuations, differing financial accounting standards, and possible political and economic volatility.
The companies engaged in the communications and technology industries are subject to fierce competition and their products and services may be subject to rapid obsolescence.
Gold is subject to the special risks associated with investing in precious metals, including but not limited to: price may be subject to wide fluctuation; the market is relatively limited; the sources are concentrated in countries that have the potential for instability; and the market is unregulated.
The information contained within this commercial email has been obtained from sources considered reliable, but we do not guarantee the foregoing material is accurate or complete.
Any information is not a complete summary or statement of all available data necessary for making an investment decision and does not constitute a recommendation. Prior to making an investment decision, please consult with your financial advisor about your individual situation.
Charts are reprinted with permission, further reproduction is strictly prohibited.
If you would like to be removed from this e-Mail Alert Notification, PLEASE click the Reply button, type "remove" or "unsubscribe" in the subject line and include your name in the message, then click Send.
