
This Week in Review 3/21/2022
“The ability to concentrate and to use time well is everything.”
Lee lacocca
Volatility works both ways… what an awesome week!!
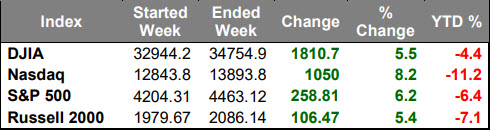
The S&P 500 rallied 6.2% this week on the back of a four-day winning streak, as the market preferred to look at things from a positive perspective. The Dow Jones Industrial Average (+5.5%) and Russell 2000 (+5.3%) each rose over 5.0% the Nasdaq Composite surged ahead with an 8.2% gain.
Ten of the 11 S&P 500 sectors closed higher with nine sectors rising between from 2.7% (real estate) to 9.3% (consumer discretionary). The energy sector (-3.6%) was the only sector that closed lower.
There wasn't a single catalyst for the rally. Instead, there was a confluence of factors that helped revive the market's spirits, including:
- Oil prices losing 5.6%
- Fed Chair Powell saying the probability of a recession within the next year is low • Early reports indicating progress in ceasefire talks between Russia and Ukraine
- China vowing support for its economy and markets
- The Producer Price Index for February increasing "just" 0.8% month-over-month (consensus 1.0%)
- Higher Q1 revenue guidance from Delta, United, and Southwest
Now, we must qualify the good news...
- Oil prices still ended the week above $100/bbl ($103.03/bbl, -6.07, -5.6%) after dropping below $95.00/bbl during the week
- Fed Chair Powell acknowledged that monetary policy could weigh on growth rates in 2023 and 2024
- Russia refuted progress in talks and continued its bombing
- China still issued a weeklong Covid lockdown of Shenzhen, a major technology hub, which could exacerbate global supply chain issues
- The Producer Price Index was still up 10.0% year-over-year
- The airlines still forecast revenue to be below pre-pandemic levels
Another valid interpretation of the rally, then, was that the market was simply due for a technical bounce, and the bearish sentiment entering the week provided the basis for the big rally. In turn, there was likely some short-covering activity in the mix.
We do find it interesting how many market “gurus” are calling this a “Bear Market Rally”, which are often most impressive but dangerous. We will take it and we will see…
Regarding the Fed's policy meeting, the central bank raised the target range for the fed funds rate by 25 basis points to 0.25-0.50%, as expected, and signaled six more rate hikes this year. Fed Chair Powell said the Fed could start to reduce the balance sheet following the May policy meeting.
Several Fed Presidents have hinted that the next hike, could be 50 basis points, as many agree the Fed is behind the curve and needs to be more aggressive.
The Treasury market experienced some curve-flattening activity with shorter-dated rates outpacing the rise of longer-dated rates. The 2-yr yield rose 21 basis points to 1.96%, and the 10-yr yield rose 15 basis points to 2.15%.
Market Update:
- Oil Prices - Oil rose, but posts second straight losing week. U.S. West Texas Intermediate (WTI) crude dug in at 1.67%, or $1.72, higher at $104.70 per barrel. Brent crude, oil's international benchmark, advanced 1.21% to end the day at $107.93 per barrel.
- Gold - Spot gold was down 1.14% at $1,920.56 per ounce, weighed down by a strong dollar and was expected to experience the biggest weekly fall since November. U.S. gold futures settled down 1.2% to $1,919.60. Silver closed at $25.173.
- U.S. Dollar - The dollar index was up 0.2%on the week. Euro/US$ exchange rate is now 1.12.
- U.S. Treasury Rates - The yield on the 10-year Treasury was 2.153% end of business Friday.
- Asian shares were mostly higher in overnight trading.
- European markets are trading a little higher.
- Domestic markets are slightly higher this morning.
The 800-pound gorilla in the room is oil and certainly it has created a lot of price instability reacting to the war and to the global sanctions to be imposed on Russia.
Oil prices had a wild week. Not only have these prices not been seen since the financial crisis, this level of price volatility is also rare. Brent prices skyrocketed when Russia invaded Ukraine and if peace talks continue in a productive direction, the supply chain issues may be resolved faster than expected.
Last week, China locked down 37 million people as the country is experiencing its worst outbreak since the start of the pandemic in Wuhan. On the supply side, Shenzhen is home to half of all the online retail exporters in China, and Dongguan is a key manufacturer of shoes, toys, and textiles.
On the consumption side, 37 million people no longer need gas for at least a week, maybe longer as the government monitors new cases and weighs shutting down more provinces. China is one of Russia’s few remaining trade partners and an extended or more widespread lockdown would provide another avenue of trade loss for the country.
The conflict in Ukraine will continue to put pressure on prices in the near term and weigh on economic activity through the rest of 2022 and into 2023, if it continues.
Peace talks allegedly have been ramping up. President Joe Biden spoke with Chinese President Xi Jinping last Friday, with Xi stating that each country is obligated to promote peace. It seems everyone (except Russia) wants this conflict resolved as quickly as possible to bring peace back to the region and end the humanitarian crisis. Many countries such as Germany and the U.S. are supplying military equipment to Ukraine to aid its struggle.
Last Tuesday, President Biden signed a new spending bill allocating $14 Billion for Ukraine aid and has promised the use of armed drones. Germany is sending antitank and anti-aircraft weapons from its own stockpile, a significant shift in its policies.
We live in sensational times, but it also important to know that these challenges are likely shorter term in nature and that we need to look beyond them to focus on our investment strategy.
Also important to note is that the Fed would not consider getting more aggressive with interest rates if they did not see a robust US economy. The fear is the Fed “kills the golden goose”.
Much to consider... have a wonderful week.
The opinions expressed herein are those of Michael Hilger and not necessarily those of Raymond James & Associates, Inc., and are subject to change without notice. The information contained in this report does not purport to be a complete description of the securities, markets, or developments referred to in this material. There is no assurance any of the trends mentioned will continue or forcasts will occur. The information has been obtained from sources considered to be reliable, but Raymond James does not guarantee that the foregoing material is accurate or complete. Any information is not a complete summary or statement of all available data necessary for making an investment decision and does not constitute a recommendation. Investing involves risk and you may incur a profit or loss regardless of strategy selected.
The information contained herein is general in nature and does not constitute legal or tax advice. Inclusion of these indexes is for illustrative purposes only. Keep in mind that individuals cannot invest directly in any index, and index performance does not include transaction costs or other fees, which will affect actual investment performance. Individual investor's results will vary. Past performance does not guarantee future results. The Dow Jones Industrial Average (INDU) is the most widely used indicator of the overall condition of the stock market, a price-weighted average of 30 actively traded blue chip stocks, primarily industrials. The Dow Jones Transportation Average (DJTA, also called the "Dow Jones Transports") is a U.S. stock market index from the Dow Jones Indices of the transportation sector, and is the most widely recognized gauge of the American transportation sector. Standard & Poor's 500 (SPX) is a basket of 500 stocks that are considered to be widely held. The S&P 500 index is weighted by market value, and its performance is thought to be representative of the stock market as a whole. The NASDAQ Composite Index (COMP.Q) is an index that indicates price movements of securities in the over-the-counter market. It includes all domestic common stocks in the NASDAQ System (approximately 5,000 stocks) and is weighted according to the market value of each listed issue. The Russell 2000 index is an unmanaged index of small cap securities which generally involve greater risks.
Investing in oil involves special risks, including the potential adverse effects of state and federal regulation and may not be suitable for all investors.
International investing involves special risks, including currency fluctuations, differing financial accounting standards, and possible political and economic volatility.
The companies engaged in the communications and technology industries are subject to fierce competition and their products and services may be subject to rapid obsolescence.
Gold is subject to the special risks associated with investing in precious metals, including but not limited to: price may be subject to wide fluctuation; the market is relatively limited; the sources are concentrated in countries that have the potential for instability; and the market is unregulated.
The information contained within this commercial email has been obtained from sources considered reliable, but we do not guarantee the foregoing material is accurate or complete.
Any information is not a complete summary or statement of all available data necessary for making an investment decision and does not constitute a recommendation. Prior to making an investment decision, please consult with your financial advisor about your individual situation.
Charts are reprinted with permission, further reproduction is strictly prohibited.
