

Employment still relatively strong but the U.S. economy is finally downshifting
- 08.02.24
- Economy & Policy
- Commentary
Chief Economist Eugenio J. Alemán discusses current economic conditions.
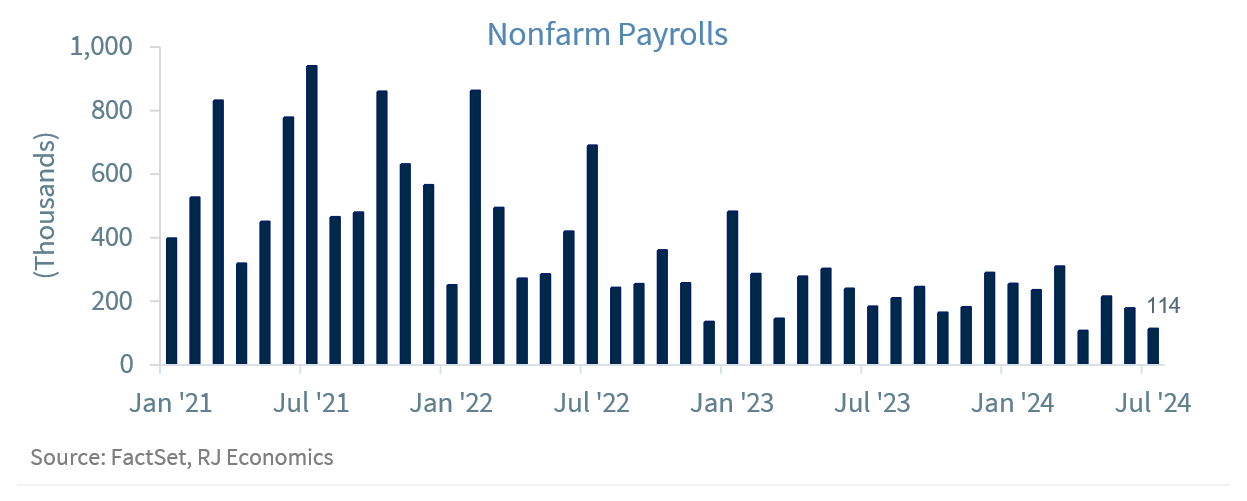
The relative weakness in July’s nonfarm payroll employment number and the increase in the rate of unemployment from 4.1% in June to 4.3% in July, triggering the Sahm Rule is a reminder of the difficult tasks ahead for the Federal Reserve (Fed). We are going to give Fed officials the ‘benefit of the doubt’ in that it did not have advanced notice of the employment numbers we were going to get two days after the decision to keep interest rates unchanged in July.
Again, even if the Sahm Rule has been triggered, we agree with the author of the Sahm Rule, that this time is different. And it is different not only for the Sahm Rule but also for a plethora of other economic indicators, starting with the yield curve, which has been inverted for more than two years, to the Leading Economic Indicator, which had been pointing to a recession for more than two years, to the ISM, manufacturing as well as services, which have been pointing to economic weakness, to household employment, which has been signaling weakness for a long time compared to the still relatively strong nonfarm employment numbers, etc.
It is clear that the pandemic recession messed up every economic indicator that economists used to use to get a feel for economic activity. And, the normalization process for these indicators will continue to take time just because the pandemic completely destroyed typical trends and patterns we used to hold true. We do not blame those who are in charge of the calculations and data processing, both federal, state, and local officials as well as those private organizations that provide timely indicators because they are doing the best they can. However, this increases the importance of interpreting data and looking at more non-traditional data, as Raymond James Chief Investment Officer Larry Adam indicated clearly during the Raymond James Summer Development Conference in Orlando in mid-July.
It is also important to remind everybody that although the nonfarm payroll number in July was much lower than expected, 114,000 jobs created is still a relatively strong number for the U.S. economy which, on average, creates about 125,000 per month.
Is the Federal Reserve behind the curve… again?
This is the question almost everybody, including the markets, is asking: after being accused of being behind the curve as inflation started to accelerate as the economy reopened from the post- pandemic recession, something that we believe was unjustified and fundamentally out of its hands, the Fed now faces the prospects of being accused of being behind the curve as real interest rates continue to bite and could, potentially, send the U.S. economy into a recession.
If this is the case and the US economy falls into a recession, this time around, it is all on the Fed.
We say this because the surge in inflation was not something the Fed could have done anything about it. As we have said so many times before, the pandemic economic cycle was a fiscal cycle, not a monetary cycle. The Fed could have hiked interest rates to, say, 5.25% immediately in the middle of the pandemic recession, but the fiscal expansion was so large that it wouldn’t have made any difference with inflation, as other countries that didn’t have the same fiscal expansion we had experienced similar inflationary pressures.
It, thus, started to increase interest rates to buy time to be in a good position once all the excess cash transferred to individuals and businesses by the federal government had been flushed out of the economy while at the same time, we waited for the disruptions to worldwide supply chains to normalize.
But the Fed knew that all those funds were almost entirely depleted during the first quarter of the year and Americans were only relying on ‘good-old-disposable-income’ to keep the economy going. But there were strong signs that this lifeline was also slowing down, so it was correct in pricing in three 25 basis points cuts for the federal funds rate before the end of the year.
Then the Fed got an inflation scare, a scare that should not have changed its view on the inflationary path and rate cuts. Many firms increased prices considerably during the first quarter of the year, something that seems to have been unexpected and probably further affected the treatment of seasonal factors. We will not know this for sure for several years, but this is what we believe happened.
This made the Fed overreact and change its view on the forward path for inflation, thus changing its view on the need to cut rates during this year. Now, this overreaction is threatening to put the Fed really against the ropes and behind the curve.
Hopefully, if we are correct, this is just a downshift in economic activity and we can avoid a recession, which is what we have in our forecast today. However, the August employment number, which is slated to be released before the Fed meets next time, will be the most important number to watch. If the August employment number is very weak, close to 100,000 or below, then it raises the probability of the Fed moving by 50bps in September. But before that, Fed officials are going to meet in Jackson Hole on August 22-24 for their Economic Policy Symposium, which has a very timely title: “Reassessing the Effectiveness and Transmission of Monetary Policy.” We really hope they reassess their ‘overreaction function’ from earlier in the year.
Economic and market conditions are subject to change.
Opinions are those of Investment Strategy and not necessarily those of Raymond James and are subject to change without notice. The information has been obtained from sources considered to be reliable, but we do not guarantee that the foregoing material is accurate or complete. There is no assurance any of the trends mentioned will continue or forecasts will occur. Last performance may not be indicative of future results.
Consumer Price Index is a measure of inflation compiled by the US Bureau of Labor Statistics. Currencies investing is generally considered speculative because of the significant potential for investment loss. Their markets are likely to be volatile and there may be sharp price fluctuations even during periods when prices overall are rising.
Consumer Sentiment is a consumer confidence index published monthly by the University of Michigan. The index is normalized to have a value of 100 in the first quarter of 1966. Each month at least 500 telephone interviews are conducted of a contiguous United States sample.
Personal Consumption Expenditures Price Index (PCE): The PCE is a measure of the prices that people living in the United States, or those buying on their behalf, pay for goods and services. The change in the PCE price index is known for capturing inflation (or deflation) across a wide range of consumer expenses and reflecting changes in consumer behavior.
The Consumer Confidence Index (CCI) is a survey, administered by The Conference Board, that measures how optimistic or pessimistic consumers are regarding their expected financial situation. A value above 100 signals a boost in the consumers’ confidence towards the future economic situation, as a consequence of which they are less prone to save, and more inclined to consume. The opposite applies to values under 100.
Certified Financial Planner Board of Standards Inc. owns the certification marks CFP®, CERTIFIED FINANCIAL PLANNER™, CFP® (with plaque design) and CFP® (with flame design) in the U.S., which it awards to individuals who successfully complete CFP Board's initial and ongoing certification requirements.
Links are being provided for information purposes only. Raymond James is not affiliated with and does not endorse, authorize or sponsor any of the listed websites or their respective sponsors. Raymond James is not responsible for the content of any website or the collection or use of information regarding any website's users and/or members.
GDP Price Index: A measure of inflation in the prices of goods and services produced in the United States. The gross domestic product price index includes the prices of U.S. goods and services exported to other countries. The prices that Americans pay for imports aren't part of this index.
The Conference Board Leading Economic Index: Intended to forecast future economic activity, it is calculated from the values of ten key variables.
The Conference Board Coincident Economic Index: An index published by the Conference Board that provides a broad-based measurement of current economic conditions.
The Conference Board lagging Economic Index: an index published monthly by the Conference Board, used to confirm and assess the direction of the economy's movements over recent months.
The U.S. Dollar Index is an index of the value of the United States dollar relative to a basket of foreign currencies, often referred to as a basket of U.S. trade partners' currencies. The Index goes up when the U.S. dollar gains "strength" when compared to other currencies.
The FHFA House Price Index (FHFA HPI®) is a comprehensive collection of public, freely available house price indexes that measure changes in single-family home values based on data from all 50 states and over 400 American cities that extend back to the mid-1970s.
Import Price Index: The import price index measure price changes in goods or services purchased from abroad by U.S. residents (imports) and sold to foreign buyers (exports). The indexes are updated once a month by the Bureau of Labor Statistics (BLS) International Price Program (IPP).
ISM New Orders Index: ISM New Order Index shows the number of new orders from customers of manufacturing firms reported by survey respondents compared to the previous month. ISM Employment Index: The ISM Manufacturing Employment Index is a component of the Manufacturing Purchasing Managers Index and reflects employment changes from industrial companies.
ISM Inventories Index: The ISM manufacturing index is a composite index that gives equal weighting to new orders, production, employment, supplier deliveries, and inventories.
ISM Production Index: The ISM manufacturing index or PMI measures the change in production levels across the U.S. economy from month to month.
ISM Services PMI Index: The Institute of Supply Management (ISM) Non-Manufacturing Purchasing Managers' Index (PMI) (also known as the ISM Services PMI) report on Business, a composite index is calculated as an indicator of the overall economic condition for the non-manufacturing sector.
Consumer Price Index (CPI) A consumer price index is a price index, the price of a weighted average market basket of consumer goods and services purchased by households. Changes in measured CPI track changes in prices over time.
Producer Price Index: A producer price index (PPI) is a price index that measures the average changes in prices received by domestic producers for their output.
Industrial production: Industrial production is a measure of output of the industrial sector of the economy. The industrial sector includes manufacturing, mining, and utilities. Although these sectors contribute only a small portion of gross domestic product, they are highly sensitive to interest rates and consumer demand.
The NAHB/Wells Fargo Housing Opportunity Index (HOI) for a given area is defined as the share of homes sold in that area that would have been affordable to a family earning the local median income, based on standard mortgage underwriting criteria.
The S&P CoreLogic Case-Shiller U.S. National Home Price NSA Index measures the change in the value of the U.S. residential housing market by tracking the purchase prices of single-family homes.
The S&P CoreLogic Case-Shiller 20-City Composite Home Price NSA Index seeks to measures the value of residential real estate in 20 major U.S. metropolitan.
Source: FactSet, data as of 7/7/2023
