
Shifting market dynamics
Drew O’Neil discusses fixed income market conditions and offers insight for bond investors.
When constructing a fixed income portfolio, product choice depends on a range of factors. Some of these factors are investor driven while some are market driven. Variables such as risk tolerance, liquidity needs, account type, and tax bracket are determined based on the individual. Market driven factors include a range of items, such as product availability, liquidity, shape of the yield curve, general interest rate levels, and the yield relationship between various products. Factors based on the individual investor’s situation are generally more stable and easily understood for an investor. Market factors are constantly changing and require monitoring, analysis, and flexibility by the investors when it comes to choosing appropriate investments.
The relationship between municipal bonds and taxable bonds has experienced a notable shift recently in a way that could have a meaningful impact on investor decisions. Generally, high tax bracket investors are best served by purchasing municipal bonds because the tax benefit that they receive overcomes the lower nominal yield. Simply put, the taxable-equivalent yield of municipal bonds is generally the most attractive opportunity for high tax bracket investors. For most of 2024, this has not been the case for municipal bonds in the short maturity range. This part of the municipal curve has been so “rich” (relatively higher priced) that even investors in the top tax bracket could achieve higher taxable-equivalent yields with corporate bonds compared with what they could get in municipal bonds. Over the past week, this dynamic has shifted back towards a more normal relationship where municipal bonds might make sense again across the entire yield curve.
One measure of this relationship that is widely followed by market participants is the muni-Treasury ratio. This is the ratio of the AAA municipal yield to the Treasury yield of the same maturity. The lower the ratio, the “richer” municipals are compared to Treasuries. The higher the ratio, the “cheaper” they are. The chart below shows the change from two months ago, showing that municipal bonds have gotten more attractive relative to Treasuries across the 5 to 10 year part of the curve. It is notable that most of this shift has actually happened in the past several weeks.

While the muni-Treasury ratio is a widely used and useful market indicator, many investors are not necessarily trying to decide between a Treasury portfolio and a AAA rated municipal portfolio. The more relevant comparison is between high-quality corporate bonds and high-quality municipal bonds. With that in mind, the below yield curves might paint a clearer picture for many investors. This chart shows a comparison of A rated corporate yields to taxable-equivalent AA rated municipal yields today versus two months ago.
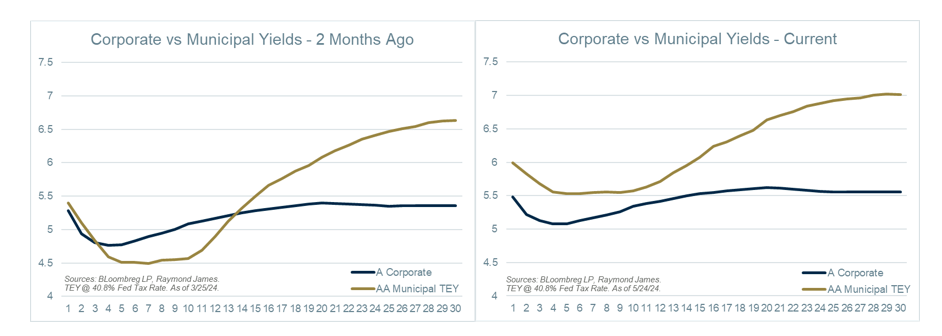
The shift is apparent. Two months ago, even for investors in the 40.8% tax bracket, corporate bonds offered more attractive taxable-equivalent yields across the short to intermediate part of the curve. The moves in the municipal curve are clear in the chart on the right. The shorter part of the curve has shifted higher, creating a flatter curve but also enhancing opportunities inside of 15 years. For top tax bracket investors, municipal bonds may be the most attractive option across the entire yield curve. Keep in mind that these dynamics and relationships can change quickly. As noted above, most of the shift in this relationship has occurred in the past 1 to 2 weeks. For this reason, it is important to keep an open mind and remain flexible rather than focus solely on a single strategy or product type in order to build an optimal portfolio at any given time. Prior to making any investment decision, discuss the current market landscape with your advisor in order to put yourself in the best position to achieve your long-term financial goals.
The author of this material is a Trader in the Fixed Income Department of Raymond James & Associates (RJA), and is not an Analyst. Any opinions expressed may differ from opinions expressed by other departments of RJA, including our Equity Research Department, and are subject to change without notice. The data and information contained herein was obtained from sources considered to be reliable, but RJA does not guarantee its accuracy and/or completeness. Neither the information nor any opinions expressed constitute a solicitation for the purchase or sale of any security referred to herein. This material may include analysis of sectors, securities and/or derivatives that RJA may have positions, long or short, held proprietarily. RJA or its affiliates may execute transactions which may not be consistent with the report’s conclusions. RJA may also have performed investment banking services for the issuers of such securities. Investors should discuss the risks inherent in bonds with their Raymond James Financial Advisor. Risks include, but are not limited to, changes in interest rates, liquidity, credit quality, volatility, and duration. Past performance is no assurance of future results.
Investment products are: not deposits, not FDIC/NCUA insured, not insured by any government agency, not bank guaranteed, subject to risk and may lose value.
To learn more about the risks and rewards of investing in fixed income, access the Financial Industry Regulatory Authority’s website at finra.org/investors/learn-to-invest/types-investments/bonds and the Municipal Securities Rulemaking Board’s (MSRB) Electronic Municipal Market Access System (EMMA) at emma.msrb.org.
