
Remember when (almost) everyone was saying that U.S. businesses were hoarding workers?
Chief Economist Eugenio J. Alemán discusses current economic conditions.
As a businessman and ex-business owner, the idea of firms ‘hoarding’ workers never made sense. As an economist, the idea of firms hoarding workers never made sense either. And since I am a business economist, the idea of firms hoarding workers is ludicrous. So why was it that so many pundits, economists, analysts, and everybody else looking at employment data during 2022 and 2023 argued that the reason for employment to be so strong during those years was because firms were hoarding workers?
Some argued that workers were so scarce that firms were reluctant to get rid of workers. Not only firms were not willing to get rid of workers, but the argument was that they wanted to continue to hire at very high rates because they didn’t know if they were going to be able to hire workers in the future.
We started writing about this issue back in October of 2022 when everybody was talking about firms ‘hoarding workers’ (See our Weekly Economics Thoughts of the Week for October 14, 2022, titled ‘Businesses Hoarding Workers? Say What?’). At that time, we argued that what firms were doing was just trying to go back to pre-pandemic levels of employment and that they were struggling to find workers, not hoarding workers. And because they were struggling to get workers, wages and salaries were going up.
But even after firms were able to catch up to pre-pandemic levels of employment in early 2023 and employment growth continued to remain strong, we argued that we needed to see an important slowdown in employment growth during the second half of 2023 because growth in employment was outpacing growth in economic activity. In our ‘Weekly Economics Thoughts of the Week’ for June 9, June 30, and July 07, 2023, we beat the drum that employment growth numbers were making no sense.
However, almost everybody else was trying to adjust their narratives to the numbers being reported rather than analyzing what was happening in the economy and concluding that job numbers coming out from the establishment survey were too good to be true. Of course, we never joined the bandwagon of conspiracy theories regarding the reason why we believed the numbers were wrong. The reason is because we have previous experience with the damage severe crises have on statistical calculations and we knew that nobody was trying to use these numbers for political purposes.
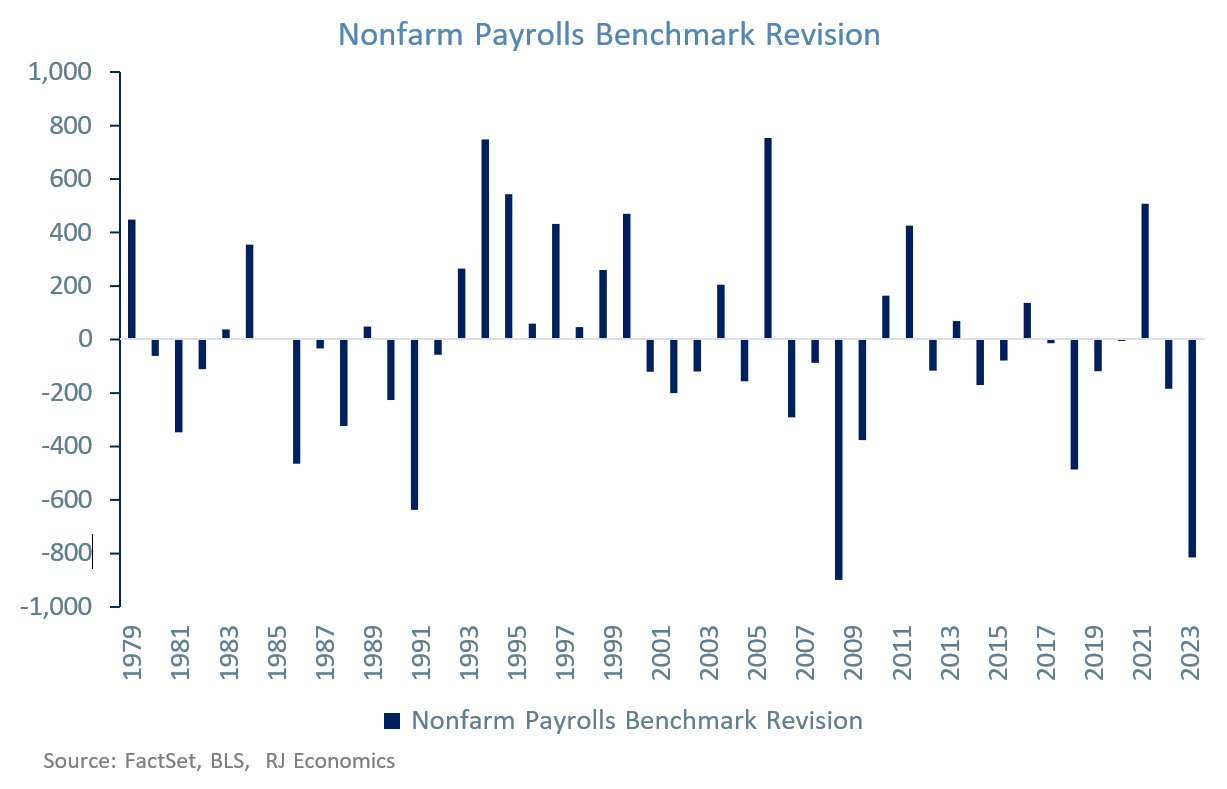
On Wednesday of this week, the Bureau of Labor Statistics (BLS) provided a preliminary estimate of the establishment benchmark revision, which indicated, preliminarily, that from April 2022 until March of 2023, the number of jobs created in the U.S. economy was revised down from an original
2.9 million to 2.1 million. That is, the BLS indicated that their preliminary revision was lower by 818 thousand than originally estimated, or about 68 thousand less per month during those 12 months.
Again, we want to put an emphasis on the preliminary nature of this number because this is not going to be the last number. The final numbers will be released when the January 2025 establishment numbers are reported, which is going to be on February 6, 2025.
If we take a look at the chart below, we see that Wednesday’s revision was second in absolute numbers to 2009’s revision, which was -902 thousand. Thus, it is clear that after a severe recession, which was the case for the Great Recession as well as the pandemic recession, these estimates tend to produce very large negative errors in nonfarm payrolls estimates.
Again, this number may come down or move higher once we get the final numbers in February of 2025, but there is nothing mysterious or nebulous about it. It is just the nature of the beast. And as our RJ CIO Larry Adam argued during the Summer Development Conference in Orlando in July of this year, this is the reason why we use a combination of sources and our experience analyzing the economy to guide our research and our view on the economy and the markets. And that is why we wrote so many reports over the last two years providing our interpretation of what was happening to the U.S. labor market.
Having said this, the large revision by the BLS still puts U.S. employment growing at a strong clip during those 12 months, with growth in nonfarm payrolls ‘slowing down’ to an average of 173 thousand from an original pace of 242 thousand, which is still extremely strong compared to a historical average of 124 thousand per month before April of 2023 and going back to 1939. Therefore, the labor market remains in good condition despite recent increases in the unemployment rate as well as our belief that it has continued to weaken. Being that ‘to maintain full employment’ is one of the Fed’s two mandates, the slowdown in employment growth is an additional reason to support our view that the Fed will ease rates starting in September.
Economic and market conditions are subject to change.
Opinions are those of Investment Strategy and not necessarily those of Raymond James and are subject to change without notice. The information has been obtained from sources considered to be reliable, but we do not guarantee that the foregoing material is accurate or complete. There is no assurance any of the trends mentioned will continue or forecasts will occur. Last performance may not be indicative of future results.
Consumer Price Index is a measure of inflation compiled by the US Bureau of Labor Statistics. Currencies investing is generally considered speculative because of the significant potential for investment loss. Their markets are likely to be volatile and there may be sharp price fluctuations even during periods when prices overall are rising.
Consumer Sentiment is a consumer confidence index published monthly by the University of Michigan. The index is normalized to have a value of 100 in the first quarter of 1966. Each month at least 500 telephone interviews are conducted of a contiguous United States sample.
Personal Consumption Expenditures Price Index (PCE): The PCE is a measure of the prices that people living in the United States, or those buying on their behalf, pay for goods and services. The change in the PCE price index is known for capturing inflation (or deflation) across a wide range of consumer expenses and reflecting changes in consumer behavior.
The Consumer Confidence Index (CCI) is a survey, administered by The Conference Board, that measures how optimistic or pessimistic consumers are regarding their expected financial situation. A value above 100 signals a boost in the consumers’ confidence towards the future economic situation, as a consequence of which they are less prone to save, and more inclined to consume. The opposite applies to values under 100.
Certified Financial Planner Board of Standards Inc. owns the certification marks CFP®, CERTIFIED FINANCIAL PLANNER™, CFP® (with plaque design) and CFP® (with flame design) in the U.S., which it awards to individuals who successfully complete CFP Board's initial and ongoing certification requirements.
Links are being provided for information purposes only. Raymond James is not affiliated with and does not endorse, authorize or sponsor any of the listed websites or their respective sponsors. Raymond James is not responsible for the content of any website or the collection or use of information regarding any website's users and/or members.
GDP Price Index: A measure of inflation in the prices of goods and services produced in the United States. The gross domestic product price index includes the prices of U.S. goods and services exported to other countries. The prices that Americans pay for imports aren't part of this index.
The Conference Board Leading Economic Index: Intended to forecast future economic activity, it is calculated from the values of ten key variables.
The Conference Board Coincident Economic Index: An index published by the Conference Board that provides a broad-based measurement of current economic conditions.
The Conference Board lagging Economic Index: an index published monthly by the Conference Board, used to confirm and assess the direction of the economy's movements over recent months.
The U.S. Dollar Index is an index of the value of the United States dollar relative to a basket of foreign currencies, often referred to as a basket of U.S. trade partners' currencies. The Index goes up when the U.S. dollar gains "strength" when compared to other currencies.
The FHFA House Price Index (FHFA HPI®) is a comprehensive collection of public, freely available house price indexes that measure changes in single-family home values based on data from all 50 states and over 400 American cities that extend back to the mid-1970s.
Import Price Index: The import price index measure price changes in goods or services purchased from abroad by U.S. residents (imports) and sold to foreign buyers (exports). The indexes are updated once a month by the Bureau of Labor Statistics (BLS) International Price Program (IPP).
ISM New Orders Index: ISM New Order Index shows the number of new orders from customers of manufacturing firms reported by survey respondents compared to the previous month. ISM Employment Index: The ISM Manufacturing Employment Index is a component of the Manufacturing Purchasing Managers Index and reflects employment changes from industrial companies.
ISM Inventories Index: The ISM manufacturing index is a composite index that gives equal weighting to new orders, production, employment, supplier deliveries, and inventories.
ISM Production Index: The ISM manufacturing index or PMI measures the change in production levels across the U.S. economy from month to month.
ISM Services PMI Index: The Institute of Supply Management (ISM) Non-Manufacturing Purchasing Managers' Index (PMI) (also known as the ISM Services PMI) report on Business, a composite index is calculated as an indicator of the overall economic condition for the non-manufacturing sector.
Consumer Price Index (CPI) A consumer price index is a price index, the price of a weighted average market basket of consumer goods and services purchased by households. Changes in measured CPI track changes in prices over time.
Producer Price Index: A producer price index (PPI) is a price index that measures the average changes in prices received by domestic producers for their output.
Industrial production: Industrial production is a measure of output of the industrial sector of the economy. The industrial sector includes manufacturing, mining, and utilities. Although these sectors contribute only a small portion of gross domestic product, they are highly sensitive to interest rates and consumer demand.
The NAHB/Wells Fargo Housing Opportunity Index (HOI) for a given area is defined as the share of homes sold in that area that would have been affordable to a family earning the local median income, based on standard mortgage underwriting criteria.
The S&P CoreLogic Case-Shiller U.S. National Home Price NSA Index measures the change in the value of the U.S. residential housing market by tracking the purchase prices of single-family homes.
The S&P CoreLogic Case-Shiller 20-City Composite Home Price NSA Index seeks to measures the value of residential real estate in 20 major U.S. metropolitan.
Source: FactSet, data as of 7/7/2023
