

One way we could explain the latest FOMC decision: Rise over run
Chief Economist Eugenio J. Alemán discusses current economic conditions.
What do we mean by ‘rise over run?’ For those of you that are math geeks, you will get it fast enough. However, for those of you who are not math geeks, ‘rise over run’ is the formula for the slope of a line. What does this have to do with the latest Federal Reserve (Fed) decision, you may ask? Please be patient as we try to explain what we mean.
Here goes. By mid-year last year, Fed officials were calling for a terminal federal funds rate for this tightening cycle of about 5.75% for the upper band of the federal funds rate, with a median of 5.6%. However, over the course of the second half of 2023, and as inflation was slowing down further, the Fed started to lower its view on the terminal rate and settled on a terminal rate of 5.25% to 5.50%, which is the rate we have today.
This federal funds rate is the ‘rise’, that is, the height that determines one of the components of the slope of a line. On the other hand, the ‘run’ is, in this case, the duration or for how long the rate is going to remain at this level in order to achieve the Fed’s target of 2% for the PCE price index.
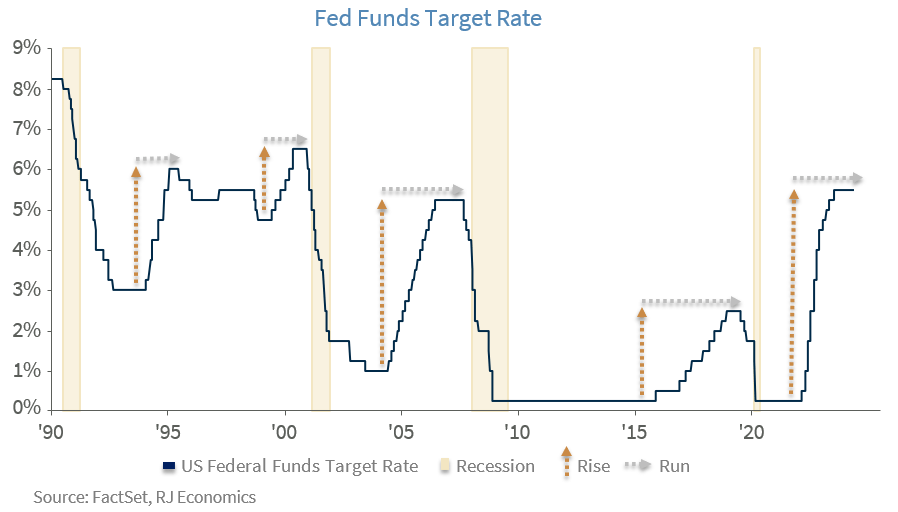
At some point last year, Fed officials thought that 5.50% (the ‘rise’) for the federal funds rate was going to be enough to bring down inflation to the 2% target rate over the long term and thus were expecting the ‘run’ to remain relatively short so they could lower rates three or more times this year. However, the very small increase in inflation during Q1 seems to have made them much more risk-averse and we are now expecting the ‘run’ to be much longer than before, with only one expected cut during this year compared to at least three earlier this year.
Of course, Fed officials could have chosen to increase the federal funds rate and keep the three cuts they expected to make during this year, but instead they decided to extend the run for a longer period of time, or what everybody is calling ‘higher for longer’.
We think the biggest risk with this decision is that the longer the Fed stays at the current nominal federal funds rate in an environment in which economic news is so fluid, with many indicators pointing to further weakness and inflation continuing to trend down, the more strains this is going to put on the economy as the real federal funds rate continues to increase. Reducing the rate cuts from three to one implies tightening monetary policy compared to expectations back in March of this year. That is, even though the Fed did not increase the ‘rise,’ the extension of the ‘run’ will mean tighter monetary policy compared to the previous expectations.
We understand that fiscal policy remains extremely expansive, and the Fed may be afraid that this fiscal expansion could keep inflation higher than what had been expected. However, everything we are watching is pointing to further weakness in economic activity, which continues to be supportive of the disinflationary process.
Furthermore, as the Fed Chairman indicated during the press conference after the FOMC meeting, some economists have challenged the strength in nonfarm payrolls due to underlying issues with the model the BLS uses to forecast business births and deaths. Thus, if the labor market is weaker than what the nonfarm payroll number is showing, we believe it would have been safe to keep the two to three rate cuts the Fed had projected earlier this year.
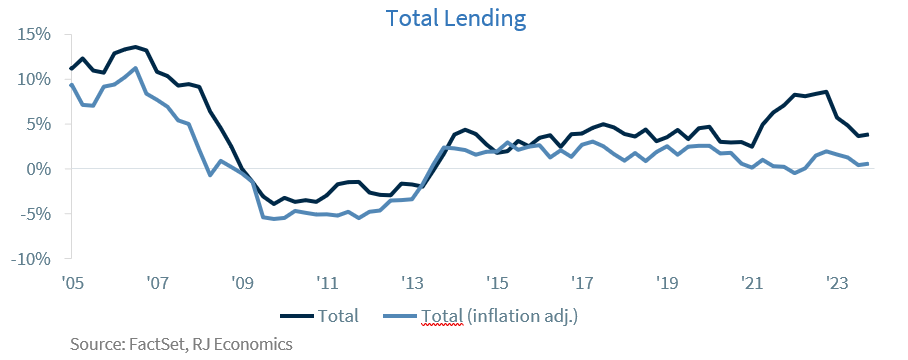
Monetary policy is very tight today and will get even tighter in the coming months. This is very clear when looking at bank lending in the graph below. Recall that what is important is inflation- adjusted, or real, lending, not nominal lending. Even credit card lending, which was growing too fast, is coming down to earth. So as a monetary economist would say, there is no breathing room for inflation to come back and justify such risk aversion from policymakers. That is, a delta of 20 basis points (bps) in expected inflation for this year does not justify a 50 bps in reduced rate cuts. Furthermore, the current soft landing of the U.S. economy is at risk.
The year is still young and if Fed officials changed their views on the terminal rate relatively quickly last year, they could do the same thing once they see inflation continuing to trend down during the second half of the year.
Federal funds rate math after the June FOMC decision
Given the June Summary of Economic Projections (SEP) and dot plot we need to adjust our federal funds rate call. We still think there is a relatively clear path to two rate cuts this year but considering that the new dot plot only has one cut we need to take this new dot plot into consideration.
If by September of this year, which is when the new SEP and dot plot are going to be released, GDP growth and inflation has remained in line with Fed official’s forecast, then we estimate that the Fed will not lower interest rates in September because it risks being accused of favoring one political side ahead of the presidential elections. Thus, if there is only one rate cut this year, we estimate that the Fed will move in November, as it meets just after the presidential election.
However, if economic growth and inflation go according to our weaker economic forecast and stronger disinflationary environment, then a September rate cut opens up again while a second rate cut could occur either in November or December.
Economic and market conditions are subject to change.
Opinions are those of Investment Strategy and not necessarily those of Raymond James and are subject to change without notice. The information has been obtained from sources considered to be reliable, but we do not guarantee that the foregoing material is accurate or complete. There is no assurance any of the trends mentioned will continue or forecasts will occur. Last performance may not be indicative of future results.
Consumer Price Index is a measure of inflation compiled by the US Bureau of Labor Statistics. Currencies investing is generally considered speculative because of the significant potential for investment loss. Their markets are likely to be volatile and there may be sharp price fluctuations even during periods when prices overall are rising.
Consumer Sentiment is a consumer confidence index published monthly by the University of Michigan. The index is normalized to have a value of 100 in the first quarter of 1966. Each month at least 500 telephone interviews are conducted of a contiguous United States sample.
Personal Consumption Expenditures Price Index (PCE): The PCE is a measure of the prices that people living in the United States, or those buying on their behalf, pay for goods and services. The change in the PCE price index is known for capturing inflation (or deflation) across a wide range of consumer expenses and reflecting changes in consumer behavior.
The Consumer Confidence Index (CCI) is a survey, administered by The Conference Board, that measures how optimistic or pessimistic consumers are regarding their expected financial situation. A value above 100 signals a boost in the consumers’ confidence towards the future economic situation, as a consequence of which they are less prone to save, and more inclined to consume. The opposite applies to values under 100.
Certified Financial Planner Board of Standards Inc. owns the certification marks CFP®, CERTIFIED FINANCIAL PLANNER™, CFP® (with plaque design) and CFP® (with flame design) in the U.S., which it awards to individuals who successfully complete CFP Board's initial and ongoing certification requirements.
Links are being provided for information purposes only. Raymond James is not affiliated with and does not endorse, authorize or sponsor any of the listed websites or their respective sponsors. Raymond James is not responsible for the content of any website or the collection or use of information regarding any website's users and/or members.
GDP Price Index: A measure of inflation in the prices of goods and services produced in the United States. The gross domestic product price index includes the prices of U.S. goods and services exported to other countries. The prices that Americans pay for imports aren't part of this index.
The Conference Board Leading Economic Index: Intended to forecast future economic activity, it is calculated from the values of ten key variables.
The Conference Board Coincident Economic Index: An index published by the Conference Board that provides a broad-based measurement of current economic conditions.
The Conference Board lagging Economic Index: an index published monthly by the Conference Board, used to confirm and assess the direction of the economy's movements over recent months.
The U.S. Dollar Index is an index of the value of the United States dollar relative to a basket of foreign currencies, often referred to as a basket of U.S. trade partners' currencies. The Index goes up when the U.S. dollar gains "strength" when compared to other currencies.
The FHFA House Price Index (FHFA HPI®) is a comprehensive collection of public, freely available house price indexes that measure changes in single-family home values based on data from all 50 states and over 400 American cities that extend back to the mid-1970s.
Import Price Index: The import price index measure price changes in goods or services purchased from abroad by U.S. residents (imports) and sold to foreign buyers (exports). The indexes are updated once a month by the Bureau of Labor Statistics (BLS) International Price Program (IPP).
ISM New Orders Index: ISM New Order Index shows the number of new orders from customers of manufacturing firms reported by survey respondents compared to the previous month. ISM Employment Index: The ISM Manufacturing Employment Index is a component of the Manufacturing Purchasing Managers Index and reflects employment changes from industrial companies.
ISM Inventories Index: The ISM manufacturing index is a composite index that gives equal weighting to new orders, production, employment, supplier deliveries, and inventories.
ISM Production Index: The ISM manufacturing index or PMI measures the change in production levels across the U.S. economy from month to month.
ISM Services PMI Index: The Institute of Supply Management (ISM) Non-Manufacturing Purchasing Managers' Index (PMI) (also known as the ISM Services PMI) report on Business, a composite index is calculated as an indicator of the overall economic condition for the non-manufacturing sector.
Consumer Price Index (CPI) A consumer price index is a price index, the price of a weighted average market basket of consumer goods and services purchased by households. Changes in measured CPI track changes in prices over time.
Producer Price Index: A producer price index (PPI) is a price index that measures the average changes in prices received by domestic producers for their output.
Industrial production: Industrial production is a measure of output of the industrial sector of the economy. The industrial sector includes manufacturing, mining, and utilities. Although these sectors contribute only a small portion of gross domestic product, they are highly sensitive to interest rates and consumer demand.
The NAHB/Wells Fargo Housing Opportunity Index (HOI) for a given area is defined as the share of homes sold in that area that would have been affordable to a family earning the local median income, based on standard mortgage underwriting criteria.
The S&P CoreLogic Case-Shiller U.S. National Home Price NSA Index measures the change in the value of the U.S. residential housing market by tracking the purchase prices of single-family homes.
The S&P CoreLogic Case-Shiller 20-City Composite Home Price NSA Index seeks to measures the value of residential real estate in 20 major U.S. metropolitan.
Source: FactSet, data as of 7/7/2023
