

Fixed Income Strategy as the Economic Cycle Takes a Turn
Doug Drabik discusses fixed income market conditions and offers insight for bond investors.
Fixed income strategy and opportunities have remained relatively unchanged over the past few months. However, the much-talked-about monetary policy change has commenced. On September 18th, U.S. Federal Reserve Chairman Jerome Powell and the Federal Open Market Committee cut the Fed Funds rate by 50 basis points.
The Treasury yield curve has been inverted for an unusually long period of time. Based on the last five Treasury curve inversion peaks (when the 3-month yield exceeds the 10-year yield the most), the average time it takes before the curve becomes positively sloped is approximately two months. Today’s Treasury curve inversion is nearing two years in length and is already 17 months past its peak. This extraordinarily prolonged inversion can be interpreted as an economic misalignment. Or is it a misjudgment?
The U.S. economy has delivered solid economic growth since the 2008-2009 Great Recession. The gross domestic product, which measures the final market value of all goods and services produced, has averaged 2.1%, tagging over 3% in 30% of the reports. It took the 2020 world pandemic (COVID-19) to slow the economy putting the country in a short-lived 2-month recession. In full disclosure, a tremendous level of government intervention was appropriated to keep the recession at bay and ensure consumers engaged in the economy. The recovery was quick, but a price was paid – inflation.
This brings us to the present-day Federal Reserve dilemma. The economic stimulus and unintended personal savings accumulated during COVID provided the consumer with an arsenal of cash to spend, and consequently, elevated economic activity and potentially prolonged this economic cycle. This simultaneously created an inflationary spiral. One of the Fed’s mandates is price stability. As prices peaked in June 2022, the Fed aggressively combatted rising inflation with 525 basis points in hikes over a 16-month period. The Fed kept this tight monetary policy for another 14 months, and it seems to have worked. Inflation has fallen more than 50% from its peak. Core Personal Consumption Expenditure (PCE), the Fed’s favored measure of inflation, has fallen to 2.62% from its February 2022 peak of 5.57%. However, their goal is 2% and inflation, as measured by Core PCE, sits 31% higher than the Fed goal.
The other Fed mandate is keeping employment at maximum capacity. The lingering period of inflation may be taking its toll. At first glance, it hasn’t appeared to decelerate consumer spending enough to slow down the economy. However, the personal savings rate is now well below any long-term average or time span examined. At the same time, consumer debt is climbing at an alarming rate, breaking all-time highs month after month. Consumers appear to be maintaining their spending but on borrowed dollars. The Bureau of Labor Statistics’ measure of job openings in the economy (JOLT) has fallen in 8 of the last 12 months reported and is off 37% from the peak job openings offered in March 2022. Once corporations start slowing their hiring, there is very little the Fed can do to reverse the trend. The Fed’s most effective way to support the labor market is to keep the economy growing.
Although GDP has surprised economists with solid upside results, government debt as a percentage of GDP has risen to a record high of 128%. With government debt high, consumer debt high, job gains slowed, and personal savings low, there are plenty of red flags for investors to take pause. The Fed has made its initial move with September’s 50bp rate cut. Historically, initial rate cuts and inverted curves which move to normal positive sloped curves precede recessions.
The current market affords investors an opportunity to lock into 4% or better yields, a historically satisfying level of income. Investors with strategies compliant with this level of income can lock into this rate for longer, thus satisfying long term strategy while ignoring short term market noise. Don’t lose sight of locking into a known level of income and cash flow at the expense of uncertain market speculation.
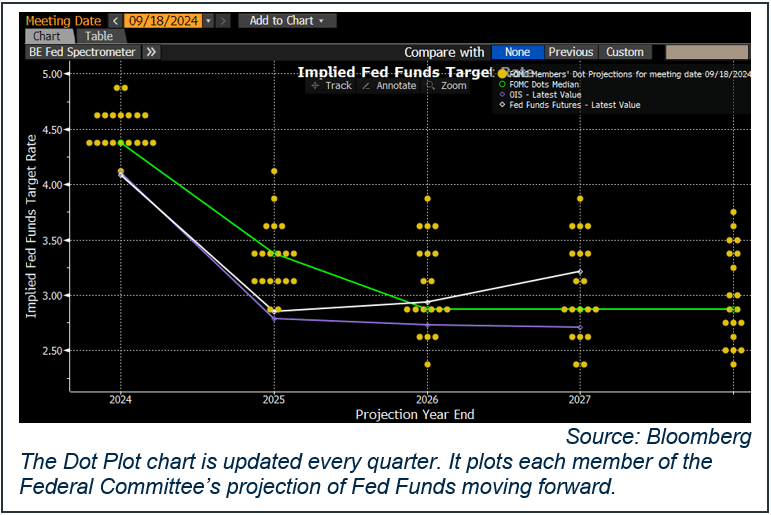
All 19 Fed members are looking for future rate cuts. It is almost inevitable that Fed Fund cuts will bring down short-term Treasury interest rates. ICI reports that money market assets have swelled to over $6.3 trillion. That is a lot of short money which has reaped the benefits of an inverted yield curve. How that money behaves as short-maturity yields begin to drop may impact all rates in general. Money earmarked for liquidity will likely stay short regardless of the overall interest rate environment. However, money designated to longer term wealth planning may eventually seek the higher rates associated with longer-term assets or even more speculative growth assets such as equities.
Volatility will likely be high as the various yield curves shift in shape while short term maturity yields will expectedly drop. I believe a majority of the future monetary policy effects are built into the intermediate and long end of the curve. It is probable that there will be a disproportionate move throughout this part of the economic cycle. For example, during the month of August, the one and two-year Treasury rates fell nearly three times as much as the 10-year Treasury rate (34bp v 12bp). So far in September, the 2-year Treasury has dropped in yield twice as much as the 10-year and the 1-year has fallen almost three times as much. It may be a series of disproportionate rate moves that finally brings the Treasury curve to a normal upward slope.

With all of this in mind, investors can still lock into 4% or better yields for longer. Historically speaking, this is a coveted long-term return for a relatively less risky asset often designated to preserving wealth. The ability to lock in income sets a solid base for fixed income allocations. High-quality, investment-grade corporate bonds continue to thrive in the short to intermediate range while municipal bonds feed off an upward sloping municipal curve 15 to 30-years out. Long term fixed income strategies remain intact.
The author of this material is a Trader in the Fixed Income Department of Raymond James & Associates (RJA), and is not an Analyst. Any opinions expressed may differ from opinions expressed by other departments of RJA, including our Equity Research Department, and are subject to change without notice. The data and information contained herein was obtained from sources considered to be reliable, but RJA does not guarantee its accuracy and/or completeness. Neither the information nor any opinions expressed constitute a solicitation for the purchase or sale of any security referred to herein. This material may include analysis of sectors, securities and/or derivatives that RJA may have positions, long or short, held proprietarily. RJA or its affiliates may execute transactions which may not be consistent with the report’s conclusions. RJA may also have performed investment banking services for the issuers of such securities. Investors should discuss the risks inherent in bonds with their Raymond James Financial Advisor. Risks include, but are not limited to, changes in interest rates, liquidity, credit quality, volatility, and duration. Past performance is no assurance of future results.
Investment products are: not deposits, not FDIC/NCUA insured, not insured by any government agency, not bank guaranteed, subject to risk and may lose value.
To learn more about the risks and rewards of investing in fixed income, access the Financial Industry Regulatory Authority’s website at finra.org/investors/learn-to-invest/types-investments/bonds and the Municipal Securities Rulemaking Board’s (MSRB) Electronic Municipal Market Access System (EMMA) at emma.msrb.org.
